Bangkok Climate & Weather Averages
Thailand · Tropical Savanna climate · Data averaged from 2020-01-01 to 2024-12-31 (5 years)
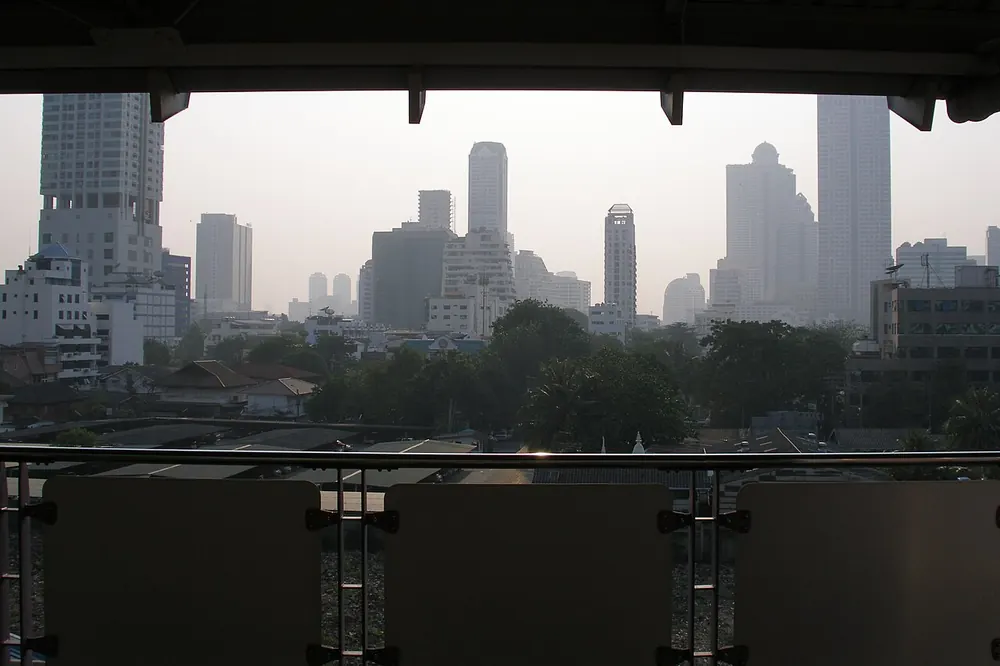
Best Time to Visit Bangkok
Based on temperature comfort, low rainfall, and sunshine hours, the best months to visit Bangkok are:
January, December, February
Scores based on ideal temperature (18-28°C), low precipitation, and high sunshine. January scores 72/100.
Bangkok has a Tropical Savanna climate with hot summers and warm winters. The warmest month is April with an average temperature of 30.0°C (86.0°F), while December is the coldest at 26.6°C (79.9°F). Annual precipitation averages 1691.0mm spread across approximately 250.0 rainy days per year, with September being the wettest month at 336.3mm and January the driest at 14.3mm. The city receives an average of 7.6-10.8 hours of sunshine per day, with the sunniest months being April and January. Humidity remains relatively consistent throughout the year, averaging around 74.8% annually, while average wind speeds reach 15.1 km/h. The overall annual mean temperature is 28.1°C (82.6°F), reflecting the tropical savanna conditions shaped by Bangkok's latitude (13.76°) and surrounding geography. For travelers, the best time to visit is January, December, February, when temperatures are comfortable and rainfall is lower.
Bangkok taught me that 'too hot' is a real concept. I arrived in April thinking I could handle it — 36°C with 70% humidity is genuinely dangerous if you're not acclimated. Pack moisture-wicking everything, plan indoor activities for 11am-3pm, and embrace the night markets. November-February is the survival window. The data backs this up: those months drop to a manageable 30°C with lower humidity and almost no rain.
Climate Insights from Our Writers
“Bangkok taught me that 'too hot' is a real and measurable concept, not just a subjective complaint. I arrived in April thinking I could handle it — 36°C with 70% humidity creates a heat index that pushes past 45°C, and that's genuinely dangerous if you're not acclimated. What I've learned from studying Bangkok's climate data is that the city operates on a rhythm dictated entirely by temperature and rainfall. The year divides into three distinct seasons: the hot season from March to June, the rainy season from July to October, and the cool season from November to February. But 'cool' is relative here — the cool season still averages 30°C during the day. What fascinates me most is how Bangkok's tropical monsoon climate creates an ecosystem where life adapts around the weather patterns. The morning market hours shift earlier during the hot season, the evening street food scene expands during the cooler months, and the entire city seems to hold its breath during the transitional periods between seasons. I've tracked the rainfall data and found that September is the wettest month with over 300mm of rain, but the rain comes in dramatic afternoon downpours that typically last 30-60 minutes before clearing to reveal steam rising from the streets. The urban heat island effect in Bangkok is among the most intense I've studied, with the dense city center creating nighttime temperatures that rarely drop below 25°C even in the cool season. This constant warmth creates a lush urban environment where tropical plants thrive and the city smells of jasmine, exhaust, and street food in equal measure. For anyone planning to visit, the November to February window is the survival zone — temperatures drop to a manageable 30°C with lower humidity and almost no rain, making it possible to actually enjoy the temples, markets, and street life without the oppressive heat that defines the rest of the year.”
— Climate & Travel Writer
Seasonal Climate Overview
Spring (Mar-May)
Average temperature 29.6°C (85.3°F), rainfall 97.1mm, sunshine 10.5 hrs/day, humidity 74.2%. Warm season conditions prevail. Expect around 20.0 rainy days per month.
Summer (Jun-Aug)
Average temperature 28.5°C (83.3°F), rainfall 204.5mm, sunshine 8.6 hrs/day, humidity 79.4%. Warm season conditions prevail. Expect around 29.8 rainy days per month.
Autumn (Sep-Nov)
Average temperature 27.2°C (81.0°F), rainfall 237.4mm, sunshine 8.6 hrs/day, humidity 80.4%. Warm season conditions prevail. Expect around 24.4 rainy days per month.
Winter (Dec-Feb)
Average temperature 27.1°C (80.8°F), rainfall 24.6mm, sunshine 10.6 hrs/day, humidity 65.2%. Warm season conditions prevail. Expect around 9.3 rainy days per month.
Monthly Temperature Averages (°C / °F)
| Month | Avg High | Avg Low | Mean Temp |
|---|---|---|---|
| January | 31.9°C (89.4°F) | 22.3°C (72.1°F) | 26.9°C (80.4°F) |
| February | 32.5°C (90.5°F) | 23.7°C (74.7°F) | 27.8°C (82.0°F) |
| March | 33.3°C (91.9°F) | 25.9°C (78.6°F) | 29.2°C (84.6°F) |
| April | 34.1°C (93.4°F) | 26.9°C (80.4°F) | 30.0°C (86.0°F) |
| May | 33.6°C (92.5°F) | 26.7°C (80.1°F) | 29.7°C (85.5°F) |
| June | 32.9°C (91.2°F) | 26.2°C (79.2°F) | 29.1°C (84.4°F) |
| July | 31.7°C (89.1°F) | 25.7°C (78.3°F) | 28.2°C (82.8°F) |
| August | 31.7°C (89.1°F) | 25.5°C (77.9°F) | 28.1°C (82.6°F) |
| September | 30.9°C (87.6°F) | 25.1°C (77.2°F) | 27.5°C (81.5°F) |
| October | 30.6°C (87.1°F) | 24.2°C (75.6°F) | 26.9°C (80.4°F) |
| November | 31.4°C (88.5°F) | 23.8°C (74.8°F) | 27.2°C (81.0°F) |
| December | 31.3°C (88.3°F) | 22.3°C (72.1°F) | 26.6°C (79.9°F) |
Monthly Precipitation (mm)
| Month | Avg Rainfall | Bar |
|---|---|---|
| January | 14.3 mm | |
| February | 44.2 mm | |
| March | 49.5 mm | |
| April | 83.5 mm | |
| May | 158.2 mm | |
| June | 155.8 mm | |
| July | 240.8 mm | |
| August | 216.9 mm | |
| September | 336.3 mm | |
| October | 289.9 mm | |
| November | 86.0 mm | |
| December | 15.4 mm |
Monthly Rainy Days (avg days with rain > 0.1mm)
| Month | Avg Rainy Days | Bar |
|---|---|---|
| January | 7.0 | |
| February | 12.6 | |
| March | 17.2 | |
| April | 17.4 | |
| May | 25.4 | |
| June | 29.2 | |
| July | 30.4 | |
| August | 29.8 | |
| September | 29.8 | |
| October | 25.8 | |
| November | 17.6 | |
| December | 8.2 |
Monthly Humidity (%)
| Month | Avg Humidity | Bar |
|---|---|---|
| January | 63.8% | |
| February | 69.3% | |
| March | 73.4% | |
| April | 73.3% | |
| May | 76.0% | |
| June | 76.6% | |
| July | 80.7% | |
| August | 81.0% | |
| September | 84.0% | |
| October | 83.1% | |
| November | 74.2% | |
| December | 62.6% |
Monthly Wind Speed (avg max km/h)
| Month | Avg Max Wind | Bar |
|---|---|---|
| January | 13.2 km/h | |
| February | 15.3 km/h | |
| March | 17.0 km/h | |
| April | 16.8 km/h | |
| May | 16.5 km/h | |
| June | 17.2 km/h | |
| July | 16.7 km/h | |
| August | 16.1 km/h | |
| September | 14.3 km/h | |
| October | 12.7 km/h | |
| November | 12.8 km/h | |
| December | 12.6 km/h |
Monthly UV Index (avg max)
| Month | UV Index | Risk Level | Bar |
|---|---|---|---|
| January | — | — | |
| February | — | — | |
| March | — | — | |
| April | — | — | |
| May | — | — | |
| June | — | — | |
| July | — | — | |
| August | — | — | |
| September | — | — | |
| October | — | — | |
| November | — | — | |
| December | — | — |
Monthly Sunshine Hours (daily average)
| Month | Avg Daily Sunshine | Bar |
|---|---|---|
| January | 10.7 hrs | |
| February | 10.6 hrs | |
| March | 10.7 hrs | |
| April | 10.8 hrs | |
| May | 10.0 hrs | |
| June | 9.5 hrs | |
| July | 8.0 hrs | |
| August | 8.2 hrs | |
| September | 7.6 hrs | |
| October | 8.3 hrs | |
| November | 9.8 hrs | |
| December | 10.4 hrs |
Frequently Asked Questions
What is the hottest month in Bangkok?
April is the hottest month with an average temperature of 30.0°C (86.0°F).
What is the coldest month in Bangkok?
December is the coldest month with an average temperature of 26.6°C (79.9°F).
What is the rainiest month in Bangkok?
September is the wettest month with an average of 336.3mm of precipitation. The city experiences about 250.0 rainy days per year.
When is the best time to visit Bangkok?
The best time to visit Bangkok is during January, December, February, when temperatures are comfortable and rainfall is lower.
Cities with Similar Climate (Tropical Savanna)
Data Source: Open-Meteo historical archive (2020-01-01 to 2024-12-31). Daily measurements aggregated into monthly climate normals. Coordinates: 13.76°, 100.5°. Timezone: Asia/Bangkok. Last updated: 2026-07-30.