Mexico City Climate & Weather Averages
Mexico · Subtropical Highlands climate · Data averaged from 2020-01-01 to 2024-12-31 (5 years)
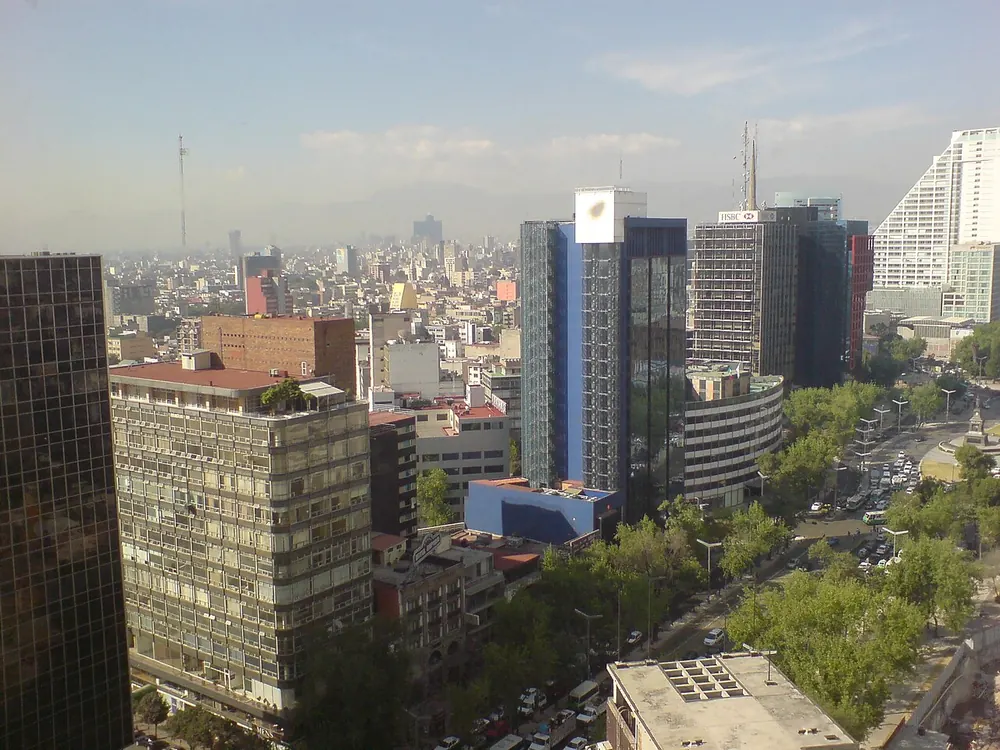
Best Time to Visit Mexico City
Based on temperature comfort, low rainfall, and sunshine hours, the best months to visit Mexico City are:
March, February, November
Scores based on ideal temperature (18-28°C), low precipitation, and high sunshine. March scores 77/100.
Mexico City has a Subtropical Highlands climate with mild summers and mild winters. The warmest month is May with an average temperature of 20.3°C (68.5°F), while January is the coldest at 14.5°C (58.1°F). Annual precipitation averages 1062.0mm spread across approximately 183.0 rainy days per year, with August being the wettest month at 261.3mm and February the driest at 5.7mm. The city receives an average of 9.9-12.1 hours of sunshine per day, with the sunniest months being May and April. Humidity remains relatively consistent throughout the year, averaging around 58.8% annually, while average wind speeds reach 18.8 km/h. The overall annual mean temperature is 17.2°C (63.0°F), reflecting the subtropical highlands conditions shaped by Mexico City's latitude (19.43°) and surrounding geography. For travelers, the best time to visit is March, February, November, when temperatures are comfortable and rainfall is lower.
Mexico City's altitude (2,240m) is the packing variable everyone forgets. I packed for 25°C days and shivered through 12°C nights — the swing is real. Layering is non-negotiable; bring a fleece even in May. The dry season (November-April) is the sweet window: 22°C, low rain, low humidity. Skip May-June when heat plus dust plus ozone make breathing uncomfortable. July-September is rainy season — spectacular afternoon thunderstorms but plan indoor mornings. Sunscreen is essential at altitude even on cloudy days. And drink water constantly; the thin air dehydrates you faster than you'd expect.
Climate Insights from Our Writers
“Mexico City's altitude of 2,240 meters is the most important factor in understanding its climate, and I've studied few cities where elevation plays such a defining role. The altitude creates a subtropical highland climate that's remarkably temperate for a city located at 19°N latitude. The data shows that the annual average temperature is 17°C, with May being the warmest month at 19°C and January the coolest at 14°C. The temperature range of just 5°C is among the narrowest I've recorded for a major city, reflecting the moderating influence of the altitude. The real challenge of Mexico City's climate is the diurnal temperature variation — the daily swing between daytime highs and nighttime lows can be 15°C or more, requiring careful wardrobe planning. The UV index is another factor that's amplified by the altitude, with levels reaching 11+ even on cloudy days, requiring serious sun protection. The rainfall pattern is distinctly seasonal, with most of the city's 800mm of annual precipitation falling between June and October. The rainy season brings dramatic afternoon thunderstorms that can flood streets but also clear the air and provide a dramatic visual spectacle. The best time for a visit is November through April, when the weather is dry and the temperatures are most comfortable. The data shows that March is the ideal month, with temperatures around 18°C, low humidity, and clear skies. For travelers, the key is preparing for the altitude — staying hydrated, allowing time for acclimatization, and packing layers for the significant daily temperature swings that define this unique highland climate.”
— Climate & Travel Writer
Seasonal Climate Overview
Spring (Mar-May)
Average temperature 19.6°C (67.3°F), rainfall 30.0mm, sunshine 11.8 hrs/day, humidity 44.2%. Mild transitional weather characterizes this period. Expect around 12.0 rainy days per month.
Summer (Jun-Aug)
Average temperature 17.9°C (64.2°F), rainfall 209.2mm, sunshine 10.9 hrs/day, humidity 70.5%. Mild transitional weather characterizes this period. Expect around 27.1 rainy days per month.
Autumn (Sep-Nov)
Average temperature 16.4°C (61.5°F), rainfall 108.0mm, sunshine 10.1 hrs/day, humidity 68.1%. Mild transitional weather characterizes this period. Expect around 17.9 rainy days per month.
Winter (Dec-Feb)
Average temperature 15.0°C (59.0°F), rainfall 6.9mm, sunshine 10.5 hrs/day, humidity 52.4%. Mild transitional weather characterizes this period. Expect around 4.0 rainy days per month.
Monthly Temperature Averages (°C / °F)
| Month | Avg High | Avg Low | Mean Temp |
|---|---|---|---|
| January | 22.8°C (73.0°F) | 7.3°C (45.1°F) | 14.5°C (58.1°F) |
| February | 25.2°C (77.4°F) | 7.7°C (45.9°F) | 16.1°C (61.0°F) |
| March | 27.7°C (81.9°F) | 10.3°C (50.5°F) | 18.7°C (65.7°F) |
| April | 28.1°C (82.6°F) | 12.3°C (54.1°F) | 19.8°C (67.6°F) |
| May | 28.1°C (82.6°F) | 13.1°C (55.6°F) | 20.3°C (68.5°F) |
| June | 26.1°C (79.0°F) | 13.6°C (56.5°F) | 19.2°C (66.6°F) |
| July | 23.3°C (73.9°F) | 13.0°C (55.4°F) | 17.4°C (63.3°F) |
| August | 22.8°C (73.0°F) | 12.7°C (54.9°F) | 17.0°C (62.6°F) |
| September | 22.6°C (72.7°F) | 12.7°C (54.9°F) | 16.9°C (62.4°F) |
| October | 23.2°C (73.8°F) | 10.9°C (51.6°F) | 16.2°C (61.2°F) |
| November | 24.1°C (75.4°F) | 9.3°C (48.7°F) | 16.1°C (61.0°F) |
| December | 22.3°C (72.1°F) | 7.8°C (46.0°F) | 14.5°C (58.1°F) |
Monthly Precipitation (mm)
| Month | Avg Rainfall | Bar |
|---|---|---|
| January | 5.8 mm | |
| February | 5.7 mm | |
| March | 8.8 mm | |
| April | 23.7 mm | |
| May | 57.6 mm | |
| June | 147.4 mm | |
| July | 218.9 mm | |
| August | 261.3 mm | |
| September | 243.4 mm | |
| October | 71.1 mm | |
| November | 9.4 mm | |
| December | 9.1 mm |
Monthly Rainy Days (avg days with rain > 0.1mm)
| Month | Avg Rainy Days | Bar |
|---|---|---|
| January | 4.2 | |
| February | 2.2 | |
| March | 6.4 | |
| April | 12.0 | |
| May | 17.6 | |
| June | 20.6 | |
| July | 30.4 | |
| August | 30.4 | |
| September | 26.6 | |
| October | 19.4 | |
| November | 7.8 | |
| December | 5.6 |
Monthly Humidity (%)
| Month | Avg Humidity | Bar |
|---|---|---|
| January | 53.6% | |
| February | 45.8% | |
| March | 40.7% | |
| April | 43.3% | |
| May | 48.5% | |
| June | 60.4% | |
| July | 74.7% | |
| August | 76.5% | |
| September | 76.0% | |
| October | 69.7% | |
| November | 58.6% | |
| December | 57.7% |
Monthly Wind Speed (avg max km/h)
| Month | Avg Max Wind | Bar |
|---|---|---|
| January | 18.7 km/h | |
| February | 20.7 km/h | |
| March | 22.9 km/h | |
| April | 23.1 km/h | |
| May | 21.7 km/h | |
| June | 20.3 km/h | |
| July | 15.5 km/h | |
| August | 15.0 km/h | |
| September | 15.7 km/h | |
| October | 18.2 km/h | |
| November | 18.1 km/h | |
| December | 16.0 km/h |
Monthly UV Index (avg max)
| Month | UV Index | Risk Level | Bar |
|---|---|---|---|
| January | — | — | |
| February | — | — | |
| March | — | — | |
| April | — | — | |
| May | — | — | |
| June | — | — | |
| July | — | — | |
| August | — | — | |
| September | — | — | |
| October | — | — | |
| November | — | — | |
| December | — | — |
Monthly Sunshine Hours (daily average)
| Month | Avg Daily Sunshine | Bar |
|---|---|---|
| January | 10.2 hrs | |
| February | 11.0 hrs | |
| March | 11.5 hrs | |
| April | 11.9 hrs | |
| May | 12.1 hrs | |
| June | 11.2 hrs | |
| July | 11.1 hrs | |
| August | 10.5 hrs | |
| September | 10.0 hrs | |
| October | 9.9 hrs | |
| November | 10.5 hrs | |
| December | 10.3 hrs |
Frequently Asked Questions
What is the hottest month in Mexico City?
May is the hottest month with an average temperature of 20.3°C (68.5°F).
What is the coldest month in Mexico City?
January is the coldest month with an average temperature of 14.5°C (58.1°F).
What is the rainiest month in Mexico City?
August is the wettest month with an average of 261.3mm of precipitation. The city experiences about 183.0 rainy days per year.
When is the best time to visit Mexico City?
The best time to visit Mexico City is during March, February, November, when temperatures are comfortable and rainfall is lower.
Cities with Similar Climate (Subtropical Highlands)
Data Source: Open-Meteo historical archive (2020-01-01 to 2024-12-31). Daily measurements aggregated into monthly climate normals. Coordinates: 19.43°, -99.13°. Timezone: America/Mexico_City. Last updated: 2026-07-30.