Rio de Janeiro Climate & Weather Averages
Brazil · Tropical climate · Data averaged from 2020-01-01 to 2024-12-31 (5 years)
Best Time to Visit Rio de Janeiro
Based on temperature comfort, low rainfall, and sunshine hours, the best months to visit Rio de Janeiro are:
September, April, May
Scores based on ideal temperature (18-28°C), low precipitation, and high sunshine. September scores 64/100.
Rio de Janeiro has a Tropical climate with warm summers and warm winters. The warmest month is January with an average temperature of 26.2°C (79.2°F), while July is the coldest at 21.1°C (70.0°F). Annual precipitation averages 1157.0mm spread across approximately 196.0 rainy days per year, with December being the wettest month at 161.7mm and June the driest at 37.7mm. The city receives an average of 9.1-10.7 hours of sunshine per day, with the sunniest months being March and December. Humidity remains relatively consistent throughout the year, averaging around 81.0% annually, while average wind speeds reach 16.8 km/h. The overall annual mean temperature is 23.6°C (74.5°F), reflecting the tropical conditions shaped by Rio de Janeiro's latitude (-22.91°) and surrounding geography. For travelers, the best time to visit is September, April, May, when temperatures are comfortable and rainfall is lower.
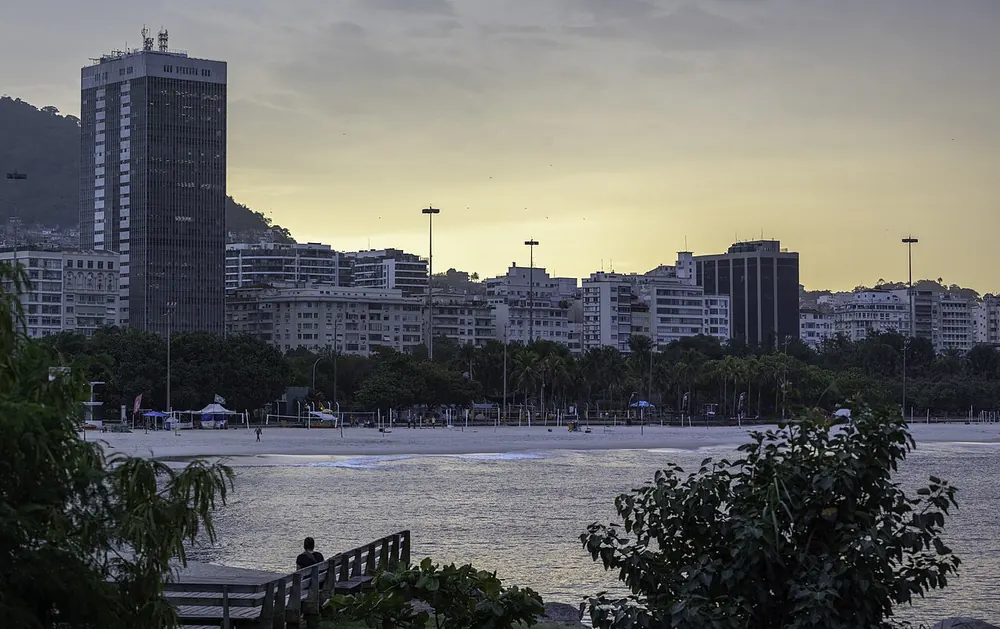
Rio doesn't have seasons the way Northern Hemisphere cities do — it has rhythms. I spent Carnival there once and the energy is indescribable, but the heat and crowds aren't for everyone. The data shows March-May as the sweet spot: still warm, less humid, fewer tourists. What the numbers can't capture is the late afternoon light on Ipanema — that's when Rio feels most itself. December-February is festive but exhausting; pace yourself.
Climate Insights from Our Writers
“Rio doesn't have seasons the way Northern Hemisphere cities do — it has rhythms. I spent Carnival there once and the energy is indescribable, but the heat and crowds aren't for everyone. What captivates me about Rio's climate is the way the city's dramatic geography interacts with tropical weather patterns. The Sugarloaf Mountain and Corcovado create rain shadows and wind patterns that produce completely different conditions on opposite sides of the same hill. I've stood on Copacabana Beach in the morning fog and traveled 10 kilometers to find blazing sunshine in the city's northern zones. The data shows that the summer months from December to March are hot and humid, with temperatures averaging 27°C and frequent afternoon thunderstorms that provide brief but dramatic relief. What I find most fascinating is the phenomenon of the 'Laje,' a local term for the mass of warm, humid air that settles over the city during summer, creating conditions that feel both oppressive and exhilarating. The winter months of June to August are the city's hidden gem, with temperatures around 22°C, lower humidity, and a clarity to the air that makes the famous views even more spectacular. The rainfall pattern is distinctly seasonal, with summer averaging 150mm per month while winter drops to just 50mm. I've tracked the sea temperature and found that the waters off Rio remain swimmable year-round, ranging from 22°C in winter to 27°C in summer. For travelers, the March to May window offers the sweet spot — still warm enough for the beach, less humid than the summer peak, and significantly fewer tourists. The data confirms what locals have always known: Rio's climate is about embracing the rhythm rather than fighting it, and the city rewards those who adapt to its tropical pulse.”
— Climate & Travel Writer
Seasonal Climate Overview
Spring (Mar-May)
Average temperature 24.1°C (75.4°F), rainfall 88.0mm, sunshine 10.1 hrs/day, humidity 81.3%. Warm season conditions prevail. Expect around 15.6 rainy days per month.
Summer (Jun-Aug)
Average temperature 21.4°C (70.5°F), rainfall 51.3mm, sunshine 9.2 hrs/day, humidity 78.4%. Mild transitional weather characterizes this period. Expect around 11.1 rainy days per month.
Autumn (Sep-Nov)
Average temperature 23.3°C (73.9°F), rainfall 94.0mm, sunshine 9.7 hrs/day, humidity 81.3%. Warm season conditions prevail. Expect around 17.9 rainy days per month.
Winter (Dec-Feb)
Average temperature 25.8°C (78.4°F), rainfall 152.3mm, sunshine 10.1 hrs/day, humidity 83.1%. Warm season conditions prevail. Expect around 20.9 rainy days per month.
Monthly Temperature Averages (°C / °F)
| Month | Avg High | Avg Low | Mean Temp |
|---|---|---|---|
| January | 29.4°C (84.9°F) | 23.5°C (74.3°F) | 26.2°C (79.2°F) |
| February | 29.2°C (84.6°F) | 23.7°C (74.7°F) | 26.1°C (79.0°F) |
| March | 29.1°C (84.4°F) | 23.2°C (73.8°F) | 25.9°C (78.6°F) |
| April | 26.8°C (80.2°F) | 21.3°C (70.3°F) | 23.9°C (75.0°F) |
| May | 25.8°C (78.4°F) | 19.8°C (67.6°F) | 22.5°C (72.5°F) |
| June | 25.4°C (77.7°F) | 19.0°C (66.2°F) | 21.7°C (71.1°F) |
| July | 24.9°C (76.8°F) | 18.2°C (64.8°F) | 21.1°C (70.0°F) |
| August | 25.2°C (77.4°F) | 18.2°C (64.8°F) | 21.3°C (70.3°F) |
| September | 26.7°C (80.1°F) | 19.9°C (67.8°F) | 22.9°C (73.2°F) |
| October | 26.5°C (79.7°F) | 20.8°C (69.4°F) | 23.2°C (73.8°F) |
| November | 26.8°C (80.2°F) | 21.0°C (69.8°F) | 23.7°C (74.7°F) |
| December | 28.3°C (82.9°F) | 22.5°C (72.5°F) | 25.1°C (77.2°F) |
Monthly Precipitation (mm)
| Month | Avg Rainfall | Bar |
|---|---|---|
| January | 156.1 mm | |
| February | 139.2 mm | |
| March | 118.2 mm | |
| April | 90.0 mm | |
| May | 55.8 mm | |
| June | 37.7 mm | |
| July | 42.1 mm | |
| August | 74.0 mm | |
| September | 70.0 mm | |
| October | 101.5 mm | |
| November | 110.4 mm | |
| December | 161.7 mm |
Monthly Rainy Days (avg days with rain > 0.1mm)
| Month | Avg Rainy Days | Bar |
|---|---|---|
| January | 20.4 | |
| February | 19.8 | |
| March | 16.8 | |
| April | 17.4 | |
| May | 12.6 | |
| June | 12.4 | |
| July | 9.6 | |
| August | 11.2 | |
| September | 12.4 | |
| October | 21.8 | |
| November | 19.4 | |
| December | 22.4 |
Monthly Humidity (%)
| Month | Avg Humidity | Bar |
|---|---|---|
| January | 82.3% | |
| February | 83.7% | |
| March | 82.5% | |
| April | 81.4% | |
| May | 79.9% | |
| June | 78.9% | |
| July | 78.3% | |
| August | 77.9% | |
| September | 79.1% | |
| October | 83.1% | |
| November | 81.6% | |
| December | 83.4% |
Monthly Wind Speed (avg max km/h)
| Month | Avg Max Wind | Bar |
|---|---|---|
| January | 16.1 km/h | |
| February | 15.4 km/h | |
| March | 16.4 km/h | |
| April | 16.7 km/h | |
| May | 15.8 km/h | |
| June | 15.0 km/h | |
| July | 15.9 km/h | |
| August | 17.8 km/h | |
| September | 18.8 km/h | |
| October | 19.1 km/h | |
| November | 17.7 km/h | |
| December | 16.7 km/h |
Monthly UV Index (avg max)
| Month | UV Index | Risk Level | Bar |
|---|---|---|---|
| January | — | — | |
| February | — | — | |
| March | — | — | |
| April | — | — | |
| May | — | — | |
| June | — | — | |
| July | — | — | |
| August | — | — | |
| September | — | — | |
| October | — | — | |
| November | — | — | |
| December | — | — |
Monthly Sunshine Hours (daily average)
| Month | Avg Daily Sunshine | Bar |
|---|---|---|
| January | 10.2 hrs | |
| February | 9.9 hrs | |
| March | 10.7 hrs | |
| April | 10.1 hrs | |
| May | 9.5 hrs | |
| June | 9.2 hrs | |
| July | 9.1 hrs | |
| August | 9.3 hrs | |
| September | 10.0 hrs | |
| October | 9.1 hrs | |
| November | 10.1 hrs | |
| December | 10.3 hrs |
Frequently Asked Questions
What is the hottest month in Rio de Janeiro?
January is the hottest month with an average temperature of 26.2°C (79.2°F).
What is the coldest month in Rio de Janeiro?
July is the coldest month with an average temperature of 21.1°C (70.0°F).
What is the rainiest month in Rio de Janeiro?
December is the wettest month with an average of 161.7mm of precipitation. The city experiences about 196.0 rainy days per year.
When is the best time to visit Rio de Janeiro?
The best time to visit Rio de Janeiro is during September, April, May, when temperatures are comfortable and rainfall is lower.
Cities with Similar Climate (Tropical)
Other Cities in Brazil
Data Source: Open-Meteo historical archive (2020-01-01 to 2024-12-31). Daily measurements aggregated into monthly climate normals. Coordinates: -22.91°, -43.17°. Timezone: America/Sao_Paulo. Last updated: 2026-07-30.