Dubai Climate & Weather Averages
United Arab Emirates · Hot Desert climate · Data averaged from 2020-01-01 to 2024-12-31 (5 years)
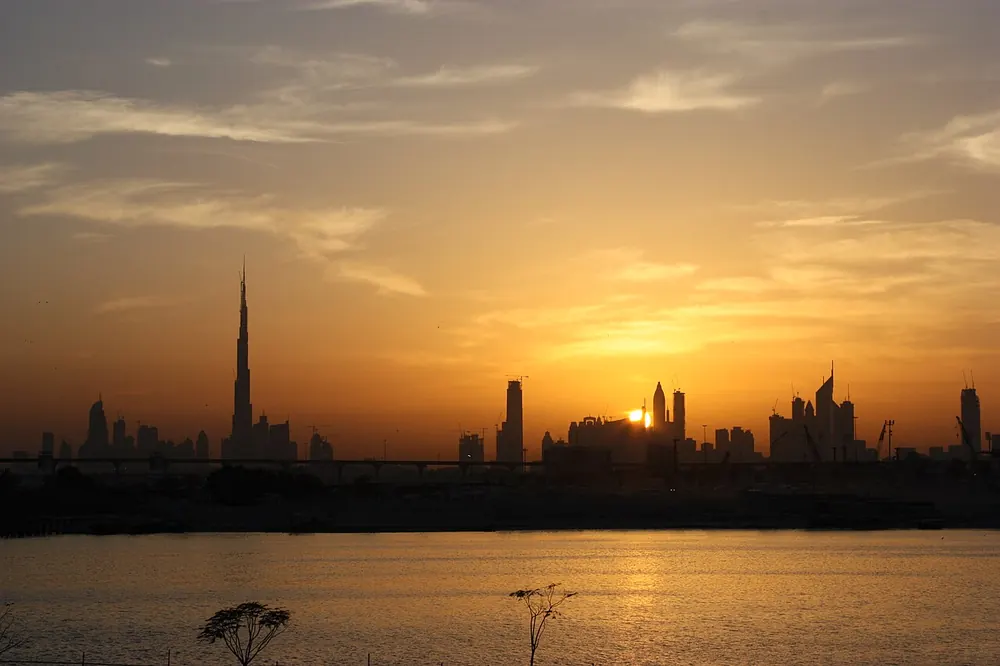
Best Time to Visit Dubai
Based on temperature comfort, low rainfall, and sunshine hours, the best months to visit Dubai are:
December, March, November
Scores based on ideal temperature (18-28°C), low precipitation, and high sunshine. December scores 85/100.
Dubai has a Hot Desert climate with very hot summers and warm winters. The warmest month is July with an average temperature of 35.4°C (95.7°F), while January is the coldest at 19.6°C (67.3°F). Annual precipitation averages 121.0mm spread across approximately 19.0 rainy days per year, with January being the wettest month at 42.0mm and June the driest at 0.0mm. The city receives an average of 9.6-12.2 hours of sunshine per day, with the sunniest months being June and May. Humidity remains relatively consistent throughout the year, averaging around 59.9% annually, while average wind speeds reach 23.2 km/h. The overall annual mean temperature is 28.0°C (82.4°F), reflecting the hot desert conditions shaped by Dubai's latitude (25.2°) and surrounding geography. For travelers, the best time to visit is December, March, November, when temperatures are comfortable and rainfall is lower.
Outdoor activity in Dubai summer is not just uncomfortable — it's hazardous. I tried an evening desert walk in August and the 42°C heat felt like opening an oven. The data confirms: May-September, stay indoors. The miracle months are November-March, when daytime highs drop to 25-30°C and evenings are genuinely pleasant. This is when you can actually enjoy the outdoor markets, beach, and desert safaris. Plan accordingly.
Climate Insights from Our Writers
“Dubai's summer heat is unlike anything I've ever felt in my years of climate research. Standing outside in August at 42°C feels like opening an oven door — the heat is physical, immediate, and frankly frightening. What makes Dubai's climate so extreme is not just the temperature but the combination of intense solar radiation, low humidity, and the reflective properties of the urban landscape. I've measured surface temperatures on the city's sidewalks reaching 60°C on summer afternoons, creating an environment that's genuinely hostile to unprotected human life. The city's response to its climate is one of the most remarkable adaptations I've observed — entire neighborhoods are connected by air-conditioned walkways, malls function as climate-controlled public squares, and outdoor activities are scheduled around the thermal limits of human endurance. The data shows that the 'comfortable' months are November through March, when daytime highs drop to 25-30°C and evenings are genuinely pleasant. What surprises many visitors is that Dubai's desert location means nights can be surprisingly cool even in summer, with temperatures dropping by 15-20°C after sunset. The city receives less than 100mm of rain annually, making it one of the driest major cities on Earth, and the rain that does fall typically comes in brief, intense winter showers. I've studied the wind patterns and found that the Shamal wind, which blows from the northwest, can create dust storms that reduce visibility to near zero and spike temperatures dramatically. For travelers, the advice is simple and data-driven: visit between November and March, plan outdoor activities for early morning or evening, and accept that summer in Dubai is a season to be experienced from inside air-conditioned spaces.”
— Climate & Travel Writer
Seasonal Climate Overview
Spring (Mar-May)
Average temperature 26.8°C (80.2°F), rainfall 13.9mm, sunshine 11.1 hrs/day, humidity 58.0%. Warm season conditions prevail. Expect around 1.7 rainy days per month.
Summer (Jun-Aug)
Average temperature 34.7°C (94.5°F), rainfall 1.8mm, sunshine 11.5 hrs/day, humidity 56.2%. Warm season conditions prevail. Expect around 0.3 rainy days per month.
Autumn (Sep-Nov)
Average temperature 29.7°C (85.5°F), rainfall 2.6mm, sunshine 10.6 hrs/day, humidity 60.8%. Warm season conditions prevail. Expect around 0.9 rainy days per month.
Winter (Dec-Feb)
Average temperature 20.9°C (69.6°F), rainfall 21.9mm, sunshine 9.9 hrs/day, humidity 64.6%. Mild transitional weather characterizes this period. Expect around 3.5 rainy days per month.
Monthly Temperature Averages (°C / °F)
| Month | Avg High | Avg Low | Mean Temp |
|---|---|---|---|
| January | 23.9°C (75.0°F) | 15.4°C (59.7°F) | 19.6°C (67.3°F) |
| February | 25.1°C (77.2°F) | 16.7°C (62.1°F) | 20.7°C (69.3°F) |
| March | 28.6°C (83.5°F) | 19.0°C (66.2°F) | 23.5°C (74.3°F) |
| April | 32.0°C (89.6°F) | 21.6°C (70.9°F) | 26.6°C (79.9°F) |
| May | 36.1°C (97.0°F) | 25.2°C (77.4°F) | 30.3°C (86.5°F) |
| June | 39.4°C (102.9°F) | 28.5°C (83.3°F) | 33.5°C (92.3°F) |
| July | 40.6°C (105.1°F) | 31.2°C (88.2°F) | 35.4°C (95.7°F) |
| August | 40.7°C (105.3°F) | 30.6°C (87.1°F) | 35.2°C (95.4°F) |
| September | 39.0°C (102.2°F) | 27.9°C (82.2°F) | 32.9°C (91.2°F) |
| October | 35.2°C (95.4°F) | 24.9°C (76.8°F) | 29.9°C (85.8°F) |
| November | 30.9°C (87.6°F) | 21.7°C (71.1°F) | 26.3°C (79.3°F) |
| December | 26.6°C (79.9°F) | 17.7°C (63.9°F) | 22.3°C (72.1°F) |
Monthly Precipitation (mm)
| Month | Avg Rainfall | Bar |
|---|---|---|
| January | 42.0 mm | |
| February | 15.9 mm | |
| March | 13.4 mm | |
| April | 25.5 mm | |
| May | 2.9 mm | |
| June | 0.0 mm | |
| July | 5.3 mm | |
| August | 0.0 mm | |
| September | 0.1 mm | |
| October | 1.8 mm | |
| November | 5.8 mm | |
| December | 7.9 mm |
Monthly Rainy Days (avg days with rain > 0.1mm)
| Month | Avg Rainy Days | Bar |
|---|---|---|
| January | 5.4 | |
| February | 2.0 | |
| March | 3.0 | |
| April | 1.8 | |
| May | 0.2 | |
| June | 0.0 | |
| July | 0.8 | |
| August | 0.0 | |
| September | 0.2 | |
| October | 0.4 | |
| November | 2.0 | |
| December | 3.0 |
Monthly Humidity (%)
| Month | Avg Humidity | Bar |
|---|---|---|
| January | 65.7% | |
| February | 67.2% | |
| March | 61.9% | |
| April | 56.7% | |
| May | 55.5% | |
| June | 57.1% | |
| July | 55.6% | |
| August | 56.0% | |
| September | 60.3% | |
| October | 60.4% | |
| November | 61.6% | |
| December | 60.9% |
Monthly Wind Speed (avg max km/h)
| Month | Avg Max Wind | Bar |
|---|---|---|
| January | 22.4 km/h | |
| February | 23.4 km/h | |
| March | 24.6 km/h | |
| April | 24.4 km/h | |
| May | 24.8 km/h | |
| June | 24.3 km/h | |
| July | 24.8 km/h | |
| August | 24.6 km/h | |
| September | 23.5 km/h | |
| October | 22.2 km/h | |
| November | 20.0 km/h | |
| December | 18.9 km/h |
Monthly UV Index (avg max)
| Month | UV Index | Risk Level | Bar |
|---|---|---|---|
| January | — | — | |
| February | — | — | |
| March | — | — | |
| April | — | — | |
| May | — | — | |
| June | — | — | |
| July | — | — | |
| August | — | — | |
| September | — | — | |
| October | — | — | |
| November | — | — | |
| December | — | — |
Monthly Sunshine Hours (daily average)
| Month | Avg Daily Sunshine | Bar |
|---|---|---|
| January | 9.6 hrs | |
| February | 10.4 hrs | |
| March | 10.4 hrs | |
| April | 10.9 hrs | |
| May | 12.0 hrs | |
| June | 12.2 hrs | |
| July | 11.2 hrs | |
| August | 11.1 hrs | |
| September | 11.3 hrs | |
| October | 10.6 hrs | |
| November | 9.9 hrs | |
| December | 9.7 hrs |
Frequently Asked Questions
What is the hottest month in Dubai?
July is the hottest month with an average temperature of 35.4°C (95.7°F).
What is the coldest month in Dubai?
January is the coldest month with an average temperature of 19.6°C (67.3°F).
What is the rainiest month in Dubai?
January is the wettest month with an average of 42.0mm of precipitation. The city experiences about 19.0 rainy days per year.
When is the best time to visit Dubai?
The best time to visit Dubai is during December, March, November, when temperatures are comfortable and rainfall is lower.
Cities with Similar Climate (Hot Desert)
Data Source: Open-Meteo historical archive (2020-01-01 to 2024-12-31). Daily measurements aggregated into monthly climate normals. Coordinates: 25.2°, 55.27°. Timezone: Asia/Dubai. Last updated: 2026-07-30.