Las Vegas Climate & Weather Averages
United States · Hot Desert climate · Data averaged from 2020-01-01 to 2024-12-31 (5 years)
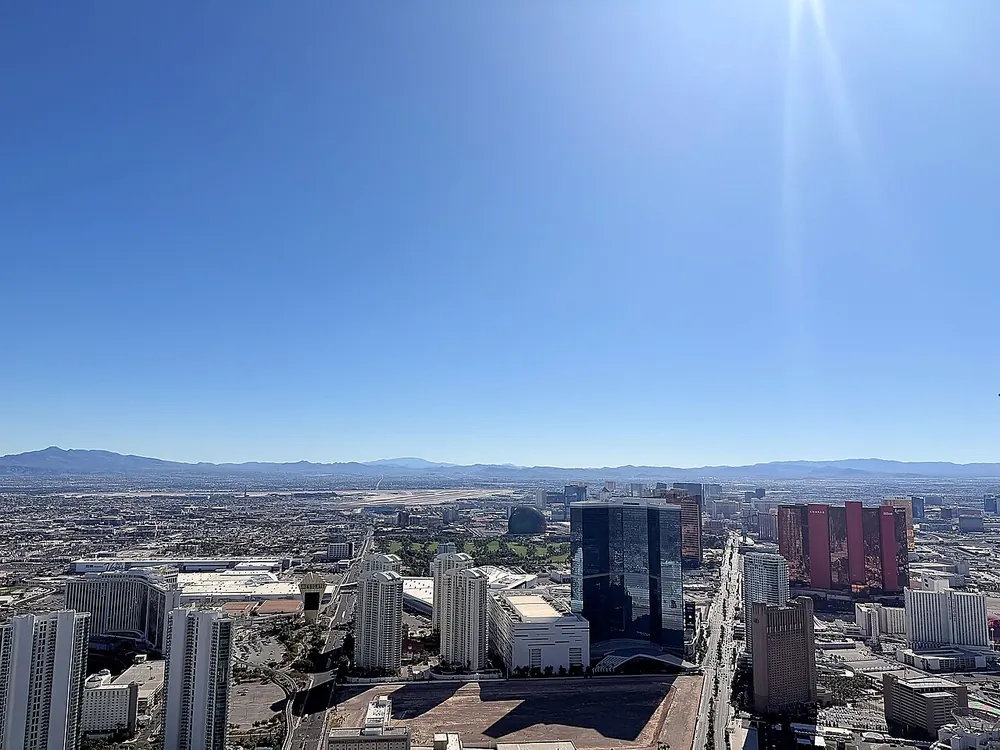
Best Time to Visit Las Vegas
Based on temperature comfort, low rainfall, and sunshine hours, the best months to visit Las Vegas are:
October, April, May
Scores based on ideal temperature (18-28°C), low precipitation, and high sunshine. October scores 91/100.
Las Vegas has a Hot Desert climate with very hot summers and mild winters. The warmest month is July with an average temperature of 35.6°C (96.1°F), while January is the coldest at 9.0°C (48.2°F). Annual precipitation averages 109.0mm spread across approximately 37.0 rainy days per year, with August being the wettest month at 20.4mm and May the driest at 0.3mm. The city receives an average of 8.1-13.6 hours of sunshine per day, with the sunniest months being June and July. Humidity remains relatively consistent throughout the year, averaging around 26.2% annually, while average wind speeds reach 21.4 km/h. The overall annual mean temperature is 21.5°C (70.7°F), reflecting the hot desert conditions shaped by Las Vegas's latitude (36.17°) and surrounding geography. For travelers, the best time to visit is October, April, May, when temperatures are comfortable and rainfall is lower.
Las Vegas tricks you with air conditioning. I stepped off the plane in July at 42°C and the terminal was 18°C — the shock is real. Pack layers for the casinos, sunscreen for outside, and accept you'll move between climate zones every 30 minutes. June-August is genuinely dangerous outside; plan pool mornings, indoor afternoons. The sweet spots are March-April and October-November: 22-26°C, perfect for hiking Red Rock. Skip December-February unless you love 12°C days and 4°C nights. Always carry water — desert dehydration sneaks up. And lip balm. Always lip balm.
Climate Insights from Our Writers
“Las Vegas presents one of the most extreme urban climates I've studied. The city sits in the Mojave Desert, and the data reflects this harsh environment — July averages 33°C, and temperatures regularly exceed 40°C during summer heatwaves. The annual precipitation is just 110mm, making it one of the driest cities in the United States. What makes Las Vegas unique is the way it has created an indoor environment that's completely disconnected from the outdoor climate. The casinos, hotels, and shopping centers are climate-controlled spaces where visitors can spend entire days without experiencing the desert heat. The best time for a visit is March through May and October through November, when temperatures range from 20°C to 30°C and the outdoor attractions — Red Rock Canyon, the Hoover Dam, the Grand Canyon — are accessible. The data shows that April and October are the ideal months, with comfortable temperatures and low rainfall. The summer months are challenging for outdoor activities, but the city's indoor attractions and pool culture offer alternative experiences. The winter months are mild, with December averaging 8°C and January reaching 14°C, making them comfortable for exploring the city and its surroundings. The low humidity is a defining characteristic of Las Vegas's climate — the dry air makes the heat feel less oppressive than in humid cities, but it also requires careful hydration and sun protection. For travelers, the key is planning outdoor activities around the temperature — early mornings and evenings in summer, midday in winter — and embracing the city's unique position as a desert oasis that offers a complete escape from the natural environment.”
— Climate & Travel Writer
Seasonal Climate Overview
Spring (Mar-May)
Average temperature 20.5°C (68.9°F), rainfall 7.2mm, sunshine 11.9 hrs/day, humidity 22.9%. Mild transitional weather characterizes this period. Expect around 3.4 rainy days per month.
Summer (Jun-Aug)
Average temperature 33.7°C (92.7°F), rainfall 9.9mm, sunshine 13.1 hrs/day, humidity 18.8%. Warm season conditions prevail. Expect around 3.0 rainy days per month.
Autumn (Sep-Nov)
Average temperature 22.0°C (71.6°F), rainfall 7.1mm, sunshine 10.5 hrs/day, humidity 24.0%. Warm season conditions prevail. Expect around 1.7 rainy days per month.
Winter (Dec-Feb)
Average temperature 9.8°C (49.6°F), rainfall 12.1mm, sunshine 8.7 hrs/day, humidity 39.0%. Mild transitional weather characterizes this period. Expect around 4.2 rainy days per month.
Monthly Temperature Averages (°C / °F)
| Month | Avg High | Avg Low | Mean Temp |
|---|---|---|---|
| January | 14.2°C (57.6°F) | 3.7°C (38.7°F) | 9.0°C (48.2°F) |
| February | 16.9°C (62.4°F) | 5.2°C (41.4°F) | 10.9°C (51.6°F) |
| March | 20.0°C (68.0°F) | 8.6°C (47.5°F) | 14.3°C (57.7°F) |
| April | 27.3°C (81.1°F) | 13.9°C (57.0°F) | 20.9°C (69.6°F) |
| May | 32.5°C (90.5°F) | 18.9°C (66.0°F) | 26.2°C (79.2°F) |
| June | 38.2°C (100.8°F) | 24.4°C (75.9°F) | 31.9°C (89.4°F) |
| July | 41.9°C (107.4°F) | 28.2°C (82.8°F) | 35.6°C (96.1°F) |
| August | 39.7°C (103.5°F) | 26.6°C (79.9°F) | 33.5°C (92.3°F) |
| September | 36.2°C (97.2°F) | 22.7°C (72.9°F) | 29.6°C (85.3°F) |
| October | 29.0°C (84.2°F) | 16.0°C (60.8°F) | 22.6°C (72.7°F) |
| November | 19.5°C (67.1°F) | 8.0°C (46.4°F) | 13.8°C (56.8°F) |
| December | 15.0°C (59.0°F) | 4.2°C (39.6°F) | 9.6°C (49.3°F) |
Monthly Precipitation (mm)
| Month | Avg Rainfall | Bar |
|---|---|---|
| January | 14.3 mm | |
| February | 14.2 mm | |
| March | 19.5 mm | |
| April | 1.9 mm | |
| May | 0.3 mm | |
| June | 3.8 mm | |
| July | 5.4 mm | |
| August | 20.4 mm | |
| September | 12.6 mm | |
| October | 3.4 mm | |
| November | 5.4 mm | |
| December | 7.7 mm |
Monthly Rainy Days (avg days with rain > 0.1mm)
| Month | Avg Rainy Days | Bar |
|---|---|---|
| January | 5.0 | |
| February | 4.6 | |
| March | 7.6 | |
| April | 1.8 | |
| May | 0.8 | |
| June | 0.8 | |
| July | 3.0 | |
| August | 5.2 | |
| September | 1.6 | |
| October | 2.0 | |
| November | 1.4 | |
| December | 3.0 |
Monthly Humidity (%)
| Month | Avg Humidity | Bar |
|---|---|---|
| January | 43.9% | |
| February | 34.7% | |
| March | 33.9% | |
| April | 19.7% | |
| May | 15.2% | |
| June | 14.3% | |
| July | 17.8% | |
| August | 24.2% | |
| September | 21.6% | |
| October | 22.3% | |
| November | 28.2% | |
| December | 38.5% |
Monthly Wind Speed (avg max km/h)
| Month | Avg Max Wind | Bar |
|---|---|---|
| January | 17.1 km/h | |
| February | 21.1 km/h | |
| March | 24.7 km/h | |
| April | 25.6 km/h | |
| May | 27.6 km/h | |
| June | 26.1 km/h | |
| July | 24.0 km/h | |
| August | 22.7 km/h | |
| September | 19.7 km/h | |
| October | 18.1 km/h | |
| November | 16.6 km/h | |
| December | 14.0 km/h |
Monthly UV Index (avg max)
| Month | UV Index | Risk Level | Bar |
|---|---|---|---|
| January | — | — | |
| February | — | — | |
| March | — | — | |
| April | — | — | |
| May | — | — | |
| June | — | — | |
| July | — | — | |
| August | — | — | |
| September | — | — | |
| October | — | — | |
| November | — | — | |
| December | — | — |
Monthly Snowfall (cm)
| Month | Avg Snowfall | Bar |
|---|---|---|
| January | 0.3 cm | |
| February | 0.4 cm | |
| March | 0.0 cm | |
| April | 0.0 cm | |
| May | 0.0 cm | |
| June | 0.0 cm | |
| July | 0.0 cm | |
| August | 0.0 cm | |
| September | 0.0 cm | |
| October | 0.0 cm | |
| November | 0.0 cm | |
| December | 0.0 cm |
Monthly Sunshine Hours (daily average)
| Month | Avg Daily Sunshine | Bar |
|---|---|---|
| January | 8.5 hrs | |
| February | 9.6 hrs | |
| March | 10.4 hrs | |
| April | 12.3 hrs | |
| May | 13.1 hrs | |
| June | 13.6 hrs | |
| July | 13.3 hrs | |
| August | 12.4 hrs | |
| September | 11.5 hrs | |
| October | 10.7 hrs | |
| November | 9.3 hrs | |
| December | 8.1 hrs |
Frequently Asked Questions
What is the hottest month in Las Vegas?
July is the hottest month with an average temperature of 35.6°C (96.1°F).
What is the coldest month in Las Vegas?
January is the coldest month with an average temperature of 9.0°C (48.2°F).
What is the rainiest month in Las Vegas?
August is the wettest month with an average of 20.4mm of precipitation. The city experiences about 37.0 rainy days per year.
When is the best time to visit Las Vegas?
The best time to visit Las Vegas is during October, April, May, when temperatures are comfortable and rainfall is lower.
Cities with Similar Climate (Hot Desert)
Other Cities in United States
Data Source: Open-Meteo historical archive (2020-01-01 to 2024-12-31). Daily measurements aggregated into monthly climate normals. Coordinates: 36.17°, -115.14°. Timezone: America/Los_Angeles. Last updated: 2026-07-30.