Chicago Climate & Weather Averages
United States · Humid Continental climate · Data averaged from 2020-01-01 to 2024-12-31 (5 years)
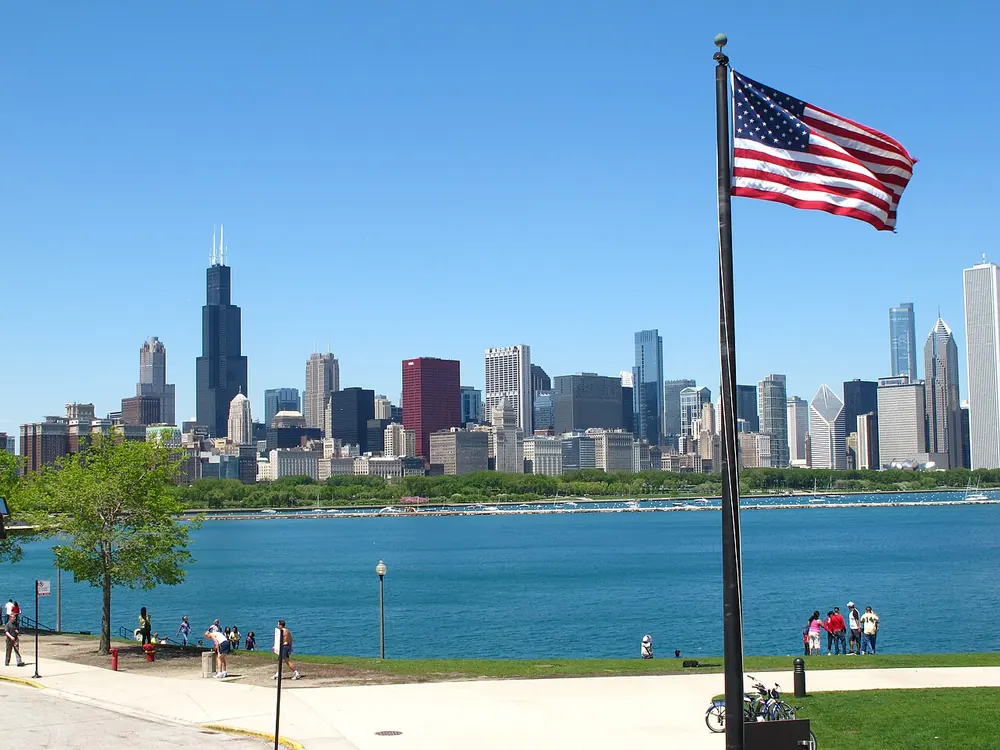
Best Time to Visit Chicago
Based on temperature comfort, low rainfall, and sunshine hours, the best months to visit Chicago are:
July, August, June
Scores based on ideal temperature (18-28°C), low precipitation, and high sunshine. July scores 66/100.
Chicago has a Humid Continental climate with warm summers and very cold winters. The warmest month is July with an average temperature of 23.1°C (73.6°F), while January is the coldest at -2.6°C (27.3°F). Annual precipitation averages 1125.0mm spread across approximately 153.0 rainy days per year, with July being the wettest month at 172.5mm and November the driest at 49.0mm. The city receives an average of 4.4-11.8 hours of sunshine per day, with the sunniest months being June and July. Humidity remains relatively consistent throughout the year, averaging around 73.2% annually, while average wind speeds reach 25.5 km/h. The overall annual mean temperature is 10.9°C (51.6°F), reflecting the humid continental conditions shaped by Chicago's latitude (41.88°) and surrounding geography. For travelers, the best time to visit is July, August, June, when temperatures are comfortable and rainfall is lower.
There's something about Chicago in January that reveals the city's true character. I visited during the polar vortex — minus 25°C, Lake Michigan frozen at the edges, and the locals still walked to their neighborhood taverns as if nothing was unusual. The cultural calendar thrives in winter: theaters full, restaurants cozy, museums uncrowded. Summer (June-August) is when Chicago reclaims its lakefront — 25°C, festivals every weekend, the energy electric. I love October: 14°C, the city in autumn colors, and a melancholy knowing winter is coming. Each season reveals a different Chicago.
Climate Insights from Our Writers
“There's something about Chicago in January that reveals the city's true character. I visited during the polar vortex — minus 25°C, Lake Michigan frozen at the edges, and the locals still walked to their neighborhood taverns as if nothing was unusual. The city's climate is one of the most extreme I've studied among major US cities, with January averaging -5°C and July reaching 24°C. The annual temperature range of nearly 30°C reflects the city's continental position, far from the moderating influence of oceans. The wind is the factor that most defines Chicago's winter experience. The city's nickname 'The Windy City' isn't just about politics — the wind off Lake Michigan creates a chill factor that can make a -5°C day feel like -20°C. The lake also creates a moderating effect in the spring and fall, keeping the lakeshore neighborhoods cooler in spring and warmer in fall than the inland areas. The best time for a visit is June through September, when the city's famous lakefront parks, festivals, and outdoor dining are at their peak. The data shows that July is the warmest month at 24°C, but the humidity can make it feel warmer. The winter months have their own appeal, with the city's cultural institutions — museums, theaters, music venues — providing world-class entertainment that's unaffected by the weather. The spring and fall seasons are brief but beautiful, with comfortable temperatures and the city's parks displaying their best colors. For travelers, Chicago offers a climate experience that rewards those who embrace the extremes — summer for the lakefront festivals and outdoor culture, winter for the cozy indoor scenes and dramatic winter landscapes.”
— Climate & Travel Writer
Seasonal Climate Overview
Spring (Mar-May)
Average temperature 9.3°C (48.7°F), rainfall 99.3mm, sunshine 8.9 hrs/day, humidity 72.5%. Mild transitional weather characterizes this period. Expect around 14.9 rainy days per month.
Summer (Jun-Aug)
Average temperature 22.5°C (72.5°F), rainfall 124.5mm, sunshine 11.7 hrs/day, humidity 73.4%. Warm season conditions prevail. Expect around 16.0 rainy days per month.
Autumn (Sep-Nov)
Average temperature 12.9°C (55.2°F), rainfall 87.4mm, sunshine 7.9 hrs/day, humidity 71.5%. Mild transitional weather characterizes this period. Expect around 12.5 rainy days per month.
Winter (Dec-Feb)
Average temperature -1.2°C (29.8°F), rainfall 63.8mm, sunshine 5.4 hrs/day, humidity 75.5%. Cold season conditions dominate. Expect around 7.6 rainy days per month.
Monthly Temperature Averages (°C / °F)
| Month | Avg High | Avg Low | Mean Temp |
|---|---|---|---|
| January | 0.7°C (33.3°F) | -5.9°C (21.4°F) | -2.6°C (27.3°F) |
| February | 2.5°C (36.5°F) | -6.2°C (20.8°F) | -1.9°C (28.6°F) |
| March | 8.7°C (47.7°F) | 0.2°C (32.4°F) | 4.2°C (39.6°F) |
| April | 13.5°C (56.3°F) | 4.4°C (39.9°F) | 8.9°C (48.0°F) |
| May | 19.3°C (66.7°F) | 10.4°C (50.7°F) | 14.9°C (58.8°F) |
| June | 26.2°C (79.2°F) | 16.9°C (62.4°F) | 21.5°C (70.7°F) |
| July | 27.1°C (80.8°F) | 19.2°C (66.6°F) | 23.1°C (73.6°F) |
| August | 27.1°C (80.8°F) | 19.1°C (66.4°F) | 22.9°C (73.2°F) |
| September | 23.8°C (74.8°F) | 15.8°C (60.4°F) | 19.6°C (67.3°F) |
| October | 17.0°C (62.6°F) | 9.0°C (48.2°F) | 12.9°C (55.2°F) |
| November | 10.1°C (50.2°F) | 2.5°C (36.5°F) | 6.2°C (43.2°F) |
| December | 4.4°C (39.9°F) | -2.2°C (28.0°F) | 1.0°C (33.8°F) |
Monthly Precipitation (mm)
| Month | Avg Rainfall | Bar |
|---|---|---|
| January | 74.6 mm | |
| February | 54.7 mm | |
| March | 95.4 mm | |
| April | 95.8 mm | |
| May | 106.7 mm | |
| June | 97.6 mm | |
| July | 172.5 mm | |
| August | 103.5 mm | |
| September | 98.2 mm | |
| October | 115.0 mm | |
| November | 49.0 mm | |
| December | 62.0 mm |
Monthly Rainy Days (avg days with rain > 0.1mm)
| Month | Avg Rainy Days | Bar |
|---|---|---|
| January | 7.2 | |
| February | 5.4 | |
| March | 13.2 | |
| April | 15.8 | |
| May | 15.6 | |
| June | 13.6 | |
| July | 17.6 | |
| August | 16.8 | |
| September | 12.4 | |
| October | 15.6 | |
| November | 9.4 | |
| December | 10.2 |
Monthly Humidity (%)
| Month | Avg Humidity | Bar |
|---|---|---|
| January | 78.3% | |
| February | 72.9% | |
| March | 73.4% | |
| April | 71.0% | |
| May | 73.1% | |
| June | 68.8% | |
| July | 76.4% | |
| August | 74.9% | |
| September | 71.9% | |
| October | 71.0% | |
| November | 71.7% | |
| December | 75.3% |
Monthly Wind Speed (avg max km/h)
| Month | Avg Max Wind | Bar |
|---|---|---|
| January | 25.8 km/h | |
| February | 28.2 km/h | |
| March | 28.6 km/h | |
| April | 28.1 km/h | |
| May | 25.3 km/h | |
| June | 24.6 km/h | |
| July | 21.9 km/h | |
| August | 21.8 km/h | |
| September | 23.6 km/h | |
| October | 26.8 km/h | |
| November | 26.4 km/h | |
| December | 25.2 km/h |
Monthly UV Index (avg max)
| Month | UV Index | Risk Level | Bar |
|---|---|---|---|
| January | — | — | |
| February | — | — | |
| March | — | — | |
| April | — | — | |
| May | — | — | |
| June | — | — | |
| July | — | — | |
| August | — | — | |
| September | — | — | |
| October | — | — | |
| November | — | — | |
| December | — | — |
Monthly Snowfall (cm)
| Month | Avg Snowfall | Bar |
|---|---|---|
| January | 27.6 cm | |
| February | 17.5 cm | |
| March | 9.7 cm | |
| April | 4.2 cm | |
| May | 0.1 cm | |
| June | 0.0 cm | |
| July | 0.0 cm | |
| August | 0.0 cm | |
| September | 0.0 cm | |
| October | 0.6 cm | |
| November | 3.5 cm | |
| December | 5.6 cm |
Monthly Sunshine Hours (daily average)
| Month | Avg Daily Sunshine | Bar |
|---|---|---|
| January | 4.4 hrs | |
| February | 7.2 hrs | |
| March | 7.6 hrs | |
| April | 8.8 hrs | |
| May | 10.2 hrs | |
| June | 11.8 hrs | |
| July | 11.7 hrs | |
| August | 11.6 hrs | |
| September | 9.6 hrs | |
| October | 7.8 hrs | |
| November | 6.4 hrs | |
| December | 4.7 hrs |
Frequently Asked Questions
What is the hottest month in Chicago?
July is the hottest month with an average temperature of 23.1°C (73.6°F).
What is the coldest month in Chicago?
January is the coldest month with an average temperature of -2.6°C (27.3°F).
What is the rainiest month in Chicago?
July is the wettest month with an average of 172.5mm of precipitation. The city experiences about 153.0 rainy days per year.
When is the best time to visit Chicago?
The best time to visit Chicago is during July, August, June, when temperatures are comfortable and rainfall is lower.
Cities with Similar Climate (Humid Continental)
Other Cities in United States
Data Source: Open-Meteo historical archive (2020-01-01 to 2024-12-31). Daily measurements aggregated into monthly climate normals. Coordinates: 41.88°, -87.63°. Timezone: America/Chicago. Last updated: 2026-07-30.