Los Angeles Climate & Weather Averages
United States · Mediterranean climate · Data averaged from 2020-01-01 to 2024-12-31 (5 years)
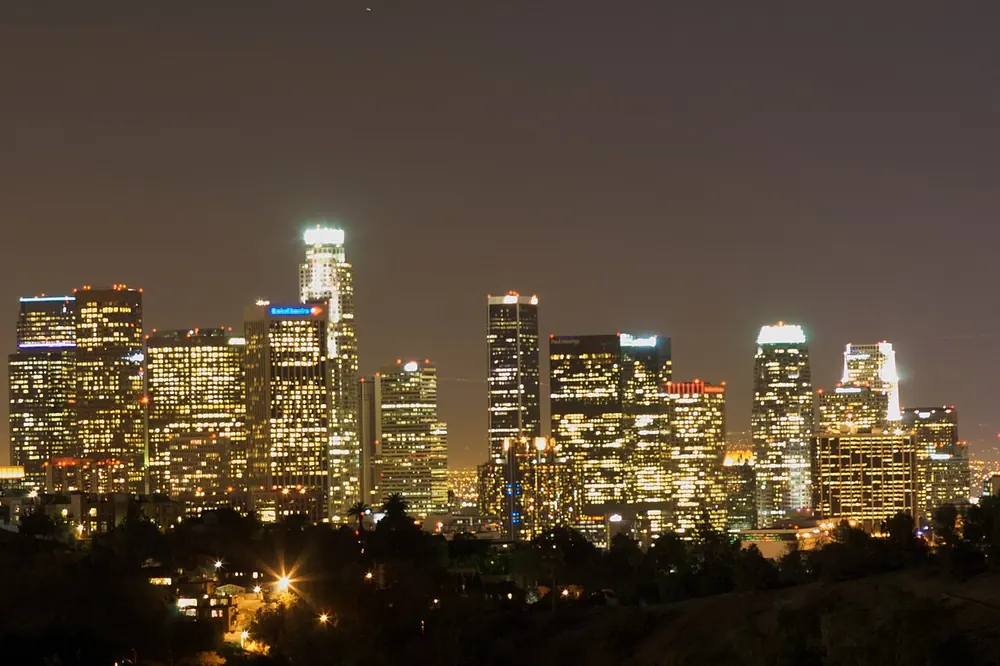
Best Time to Visit Los Angeles
Based on temperature comfort, low rainfall, and sunshine hours, the best months to visit Los Angeles are:
July, June, October
Scores based on ideal temperature (18-28°C), low precipitation, and high sunshine. July scores 96/100.
Los Angeles has a Mediterranean climate with warm summers and mild winters. The warmest month is August with an average temperature of 23.7°C (74.7°F), while January is the coldest at 12.4°C (54.3°F). Annual precipitation averages 484.0mm spread across approximately 60.0 rainy days per year, with December being the wettest month at 103.3mm and July the driest at 1.7mm. The city receives an average of 7.8-13.0 hours of sunshine per day, with the sunniest months being July and June. Humidity remains relatively consistent throughout the year, averaging around 63.0% annually, while average wind speeds reach 17.4 km/h. The overall annual mean temperature is 17.8°C (64.0°F), reflecting the mediterranean conditions shaped by Los Angeles's latitude (34.05°) and surrounding geography. For travelers, the best time to visit is July, June, October, when temperatures are comfortable and rainfall is lower.
LA's reputation for perfect weather is mostly earned — but the microclimates will trick you. I packed for Santa Monica's 22°C and froze in Pacific Palisades' morning fog. September is the secret heat wave: 30°C inland, smoggy, oppressive. Pack layers even in summer — the marine layer keeps the coast 5°C cooler than 5km inland. May and October are my favorite windows: clear, 23°C, less traffic. Skip July-August if you're beach-phobic; the crowds at Venice are intense. December-March is underrated — 18°C, empty hiking trails, occasional dramatic rain.
Climate Insights from Our Writers
“LA's reputation for perfect weather is mostly earned, but the microclimates will trick you. I've spent significant time studying the city's complex weather patterns, and what I've found is that Los Angeles isn't a single climate — it's a collection of microclimates that can differ dramatically within a few miles. The coast is cool and often foggy, the inland valleys can be scorching, and the mountains create their own weather systems. The data shows that the average temperature in downtown LA is 19°C, but this masks a range that goes from 14°C in January to 25°C in August. The real story is the 'June Gloom' — a persistent marine layer that can keep the coast overcast and cool while inland areas are sunny and warm. I've tracked this phenomenon and found that it typically burns off by midday, but in some years it can persist for weeks. The best time for a visit is September through October, when the marine layer retreats, the temperatures are at their warmest, and the city's outdoor culture is at its peak. The spring months of March through May are also excellent, with comfortable temperatures and the hills covered in green from the winter rains. The rainfall is concentrated in the winter months, with most of the city's 380mm annual precipitation falling between November and March. The summer months are almost completely dry, creating the fire conditions that have become an increasingly serious challenge for the region. For travelers, the key is understanding that LA's climate varies by location and season, and the best experience comes from matching your activities to the microclimate that suits them.”
— Climate & Travel Writer
Seasonal Climate Overview
Spring (Mar-May)
Average temperature 16.1°C (61.0°F), rainfall 44.3mm, sunshine 10.7 hrs/day, humidity 66.7%. Mild transitional weather characterizes this period. Expect around 7.9 rainy days per month.
Summer (Jun-Aug)
Average temperature 22.3°C (72.1°F), rainfall 9.5mm, sunshine 12.4 hrs/day, humidity 65.9%. Warm season conditions prevail. Expect around 1.7 rainy days per month.
Autumn (Sep-Nov)
Average temperature 19.8°C (67.6°F), rainfall 13.3mm, sunshine 9.9 hrs/day, humidity 58.4%. Mild transitional weather characterizes this period. Expect around 3.5 rainy days per month.
Winter (Dec-Feb)
Average temperature 13.0°C (55.4°F), rainfall 94.1mm, sunshine 8.5 hrs/day, humidity 61.0%. Mild transitional weather characterizes this period. Expect around 6.9 rainy days per month.
Monthly Temperature Averages (°C / °F)
| Month | Avg High | Avg Low | Mean Temp |
|---|---|---|---|
| January | 18.6°C (65.5°F) | 7.6°C (45.7°F) | 12.4°C (54.3°F) |
| February | 20.1°C (68.2°F) | 7.9°C (46.2°F) | 13.3°C (55.9°F) |
| March | 19.8°C (67.6°F) | 9.0°C (48.2°F) | 13.8°C (56.8°F) |
| April | 23.5°C (74.3°F) | 11.1°C (52.0°F) | 16.4°C (61.5°F) |
| May | 24.8°C (76.6°F) | 13.2°C (55.8°F) | 18.0°C (64.4°F) |
| June | 27.9°C (82.2°F) | 15.4°C (59.7°F) | 20.6°C (69.1°F) |
| July | 31.1°C (88.0°F) | 16.9°C (62.4°F) | 22.7°C (72.9°F) |
| August | 31.9°C (89.4°F) | 17.9°C (64.2°F) | 23.7°C (74.7°F) |
| September | 31.1°C (88.0°F) | 17.6°C (63.7°F) | 23.1°C (73.6°F) |
| October | 28.2°C (82.8°F) | 15.0°C (59.0°F) | 20.3°C (68.5°F) |
| November | 23.6°C (74.5°F) | 10.4°C (50.7°F) | 16.0°C (60.8°F) |
| December | 19.5°C (67.1°F) | 8.5°C (47.3°F) | 13.3°C (55.9°F) |
Monthly Precipitation (mm)
| Month | Avg Rainfall | Bar |
|---|---|---|
| January | 83.2 mm | |
| February | 95.9 mm | |
| March | 100.2 mm | |
| April | 25.2 mm | |
| May | 7.4 mm | |
| June | 9.3 mm | |
| July | 1.7 mm | |
| August | 17.6 mm | |
| September | 16.7 mm | |
| October | 6.3 mm | |
| November | 17.0 mm | |
| December | 103.3 mm |
Monthly Rainy Days (avg days with rain > 0.1mm)
| Month | Avg Rainy Days | Bar |
|---|---|---|
| January | 6.2 | |
| February | 7.0 | |
| March | 12.6 | |
| April | 6.0 | |
| May | 5.0 | |
| June | 2.8 | |
| July | 0.6 | |
| August | 1.6 | |
| September | 3.8 | |
| October | 2.8 | |
| November | 4.0 | |
| December | 7.4 |
Monthly Humidity (%)
| Month | Avg Humidity | Bar |
|---|---|---|
| January | 65.7% | |
| February | 56.8% | |
| March | 67.3% | |
| April | 65.3% | |
| May | 67.6% | |
| June | 66.3% | |
| July | 65.8% | |
| August | 65.7% | |
| September | 65.3% | |
| October | 59.4% | |
| November | 50.4% | |
| December | 60.6% |
Monthly Wind Speed (avg max km/h)
| Month | Avg Max Wind | Bar |
|---|---|---|
| January | 13.9 km/h | |
| February | 17.2 km/h | |
| March | 19.4 km/h | |
| April | 19.3 km/h | |
| May | 19.4 km/h | |
| June | 19.0 km/h | |
| July | 18.9 km/h | |
| August | 19.2 km/h | |
| September | 18.5 km/h | |
| October | 16.6 km/h | |
| November | 14.3 km/h | |
| December | 12.6 km/h |
Monthly UV Index (avg max)
| Month | UV Index | Risk Level | Bar |
|---|---|---|---|
| January | — | — | |
| February | — | — | |
| March | — | — | |
| April | — | — | |
| May | — | — | |
| June | — | — | |
| July | — | — | |
| August | — | — | |
| September | — | — | |
| October | — | — | |
| November | — | — | |
| December | — | — |
Monthly Snowfall (cm)
| Month | Avg Snowfall | Bar |
|---|---|---|
| January | 0.0 cm | |
| February | 0.2 cm | |
| March | 0.0 cm | |
| April | 0.0 cm | |
| May | 0.0 cm | |
| June | 0.0 cm | |
| July | 0.0 cm | |
| August | 0.0 cm | |
| September | 0.0 cm | |
| October | 0.0 cm | |
| November | 0.0 cm | |
| December | 0.0 cm |
Monthly Sunshine Hours (daily average)
| Month | Avg Daily Sunshine | Bar |
|---|---|---|
| January | 8.5 hrs | |
| February | 9.1 hrs | |
| March | 10.0 hrs | |
| April | 10.8 hrs | |
| May | 11.3 hrs | |
| June | 12.1 hrs | |
| July | 13.0 hrs | |
| August | 12.1 hrs | |
| September | 10.7 hrs | |
| October | 9.8 hrs | |
| November | 9.2 hrs | |
| December | 7.8 hrs |
Frequently Asked Questions
What is the hottest month in Los Angeles?
August is the hottest month with an average temperature of 23.7°C (74.7°F).
What is the coldest month in Los Angeles?
January is the coldest month with an average temperature of 12.4°C (54.3°F).
What is the rainiest month in Los Angeles?
December is the wettest month with an average of 103.3mm of precipitation. The city experiences about 60.0 rainy days per year.
When is the best time to visit Los Angeles?
The best time to visit Los Angeles is during July, June, October, when temperatures are comfortable and rainfall is lower.
Cities with Similar Climate (Mediterranean)
Other Cities in United States
Data Source: Open-Meteo historical archive (2020-01-01 to 2024-12-31). Daily measurements aggregated into monthly climate normals. Coordinates: 34.05°, -118.24°. Timezone: America/Los_Angeles. Last updated: 2026-07-30.