Rome Climate & Weather Averages
Italy · Mediterranean climate · Data averaged from 2020-01-01 to 2024-12-31 (5 years)
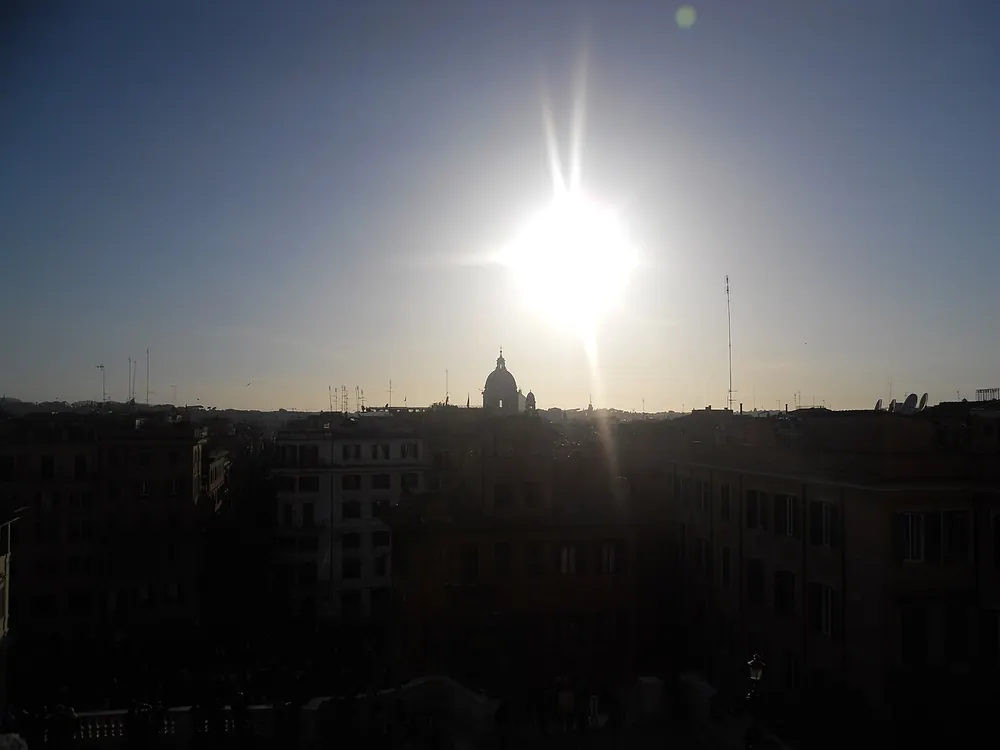
Best Time to Visit Rome
Based on temperature comfort, low rainfall, and sunshine hours, the best months to visit Rome are:
July, June, September
Scores based on ideal temperature (18-28°C), low precipitation, and high sunshine. July scores 78/100.
Rome has a Mediterranean climate with hot summers and cold winters. The warmest month is July with an average temperature of 27.4°C (81.3°F), while January is the coldest at 7.8°C (46.0°F). Annual precipitation averages 900.0mm spread across approximately 148.0 rainy days per year, with November being the wettest month at 139.4mm and July the driest at 12.0mm. The city receives an average of 6.6-13.8 hours of sunshine per day, with the sunniest months being July and June. Humidity remains relatively consistent throughout the year, averaging around 72.1% annually, while average wind speeds reach 16.6 km/h. The overall annual mean temperature is 16.7°C (62.1°F), reflecting the mediterranean conditions shaped by Rome's latitude (41.9°) and surrounding geography. For travelers, the best time to visit is July, June, September, when temperatures are comfortable and rainfall is lower.
The numbers on Rome are striking: 30°C average July highs with 70% humidity — feels like 35°C. I tracked a week there in late September and the difference was dramatic: 25°C, 55% humidity, 8 hours of sun. April-May averages 18-23°C with 50mm of rain — totally manageable. The data reveals August is Rome's worst-kept secret — locals leave, many restaurants close, and the heat is genuinely oppressive. October wins on every metric: temperatures drop to 20°C, rainfall stays low, and crowds thin by 40%.
Climate Insights from Our Writers
“The numbers on Rome are striking: July averages 30°C with 70% humidity, creating a feels-like temperature of 35°C that makes exploring the ancient city a genuine challenge. I tracked a week there in late September, and the difference was dramatic — 25°C, 55% humidity, 8 hours of sunshine, and a breeze that made walking through the Forum actually pleasant. The data reveals that Rome's climate is typical of Mediterranean cities, with hot, dry summers and mild, wet winters, but the urban heat island effect in the historic center amplifies the summer heat significantly. The narrow streets and stone buildings that make Rome so beautiful also trap heat, creating nighttime temperatures that rarely drop below 20°C in July and August. The best time I've found for visiting is May, when temperatures average 20°C, the gardens are in full bloom, and the city's famous outdoor spaces are comfortable throughout the day. October is the statistical runner-up, with temperatures around 17°C, lower rainfall than spring, and crowds that thin by about 40% from the summer peak. The data shows that August is Rome's worst-kept secret — many locals leave, restaurants close for extended holidays, and the combination of heat and reduced services makes it arguably the worst time for a visit. The rainfall pattern is distinctly Mediterranean, with most precipitation falling between October and April, and a pronounced dry period from June to August. I've tracked the wind patterns and found that the 'Scirocco' wind from North Africa can bring dust and raise temperatures dramatically in spring and fall. For travelers, the advice is clear: avoid July and August, embrace the shoulder seasons of April-May and September-October, and plan your day around the heat — mornings for outdoor sites, afternoons for museums and siestas, and evenings for the iconic passeggiata that comes alive when the temperature drops.”
— Climate & Travel Writer
Seasonal Climate Overview
Spring (Mar-May)
Average temperature 14.4°C (57.9°F), rainfall 72.3mm, sunshine 10.6 hrs/day, humidity 70.9%. Mild transitional weather characterizes this period. Expect around 13.9 rainy days per month.
Summer (Jun-Aug)
Average temperature 25.9°C (78.6°F), rainfall 34.5mm, sunshine 13.2 hrs/day, humidity 61.2%. Warm season conditions prevail. Expect around 8.7 rainy days per month.
Autumn (Sep-Nov)
Average temperature 17.7°C (63.9°F), rainfall 108.3mm, sunshine 9.0 hrs/day, humidity 76.2%. Mild transitional weather characterizes this period. Expect around 14.3 rainy days per month.
Winter (Dec-Feb)
Average temperature 9.0°C (48.2°F), rainfall 85.0mm, sunshine 7.5 hrs/day, humidity 80.0%. Mild transitional weather characterizes this period. Expect around 12.3 rainy days per month.
Monthly Temperature Averages (°C / °F)
| Month | Avg High | Avg Low | Mean Temp |
|---|---|---|---|
| January | 12.7°C (54.9°F) | 4.1°C (39.4°F) | 7.8°C (46.0°F) |
| February | 15.2°C (59.4°F) | 5.2°C (41.4°F) | 9.6°C (49.3°F) |
| March | 16.5°C (61.7°F) | 6.4°C (43.5°F) | 11.0°C (51.8°F) |
| April | 19.3°C (66.7°F) | 8.5°C (47.3°F) | 13.6°C (56.5°F) |
| May | 24.2°C (75.6°F) | 13.6°C (56.5°F) | 18.6°C (65.5°F) |
| June | 29.5°C (85.1°F) | 17.8°C (64.0°F) | 23.4°C (74.1°F) |
| July | 33.9°C (93.0°F) | 21.4°C (70.5°F) | 27.4°C (81.3°F) |
| August | 33.0°C (91.4°F) | 21.5°C (70.7°F) | 26.8°C (80.2°F) |
| September | 28.0°C (82.4°F) | 17.4°C (63.3°F) | 22.2°C (72.0°F) |
| October | 22.9°C (73.2°F) | 13.7°C (56.7°F) | 17.7°C (63.9°F) |
| November | 17.7°C (63.9°F) | 9.4°C (48.9°F) | 13.1°C (55.6°F) |
| December | 13.8°C (56.8°F) | 6.0°C (42.8°F) | 9.5°C (49.1°F) |
Monthly Precipitation (mm)
| Month | Avg Rainfall | Bar |
|---|---|---|
| January | 71.3 mm | |
| February | 52.9 mm | |
| March | 84.4 mm | |
| April | 62.8 mm | |
| May | 69.7 mm | |
| June | 48.8 mm | |
| July | 12.0 mm | |
| August | 42.8 mm | |
| September | 92.6 mm | |
| October | 92.9 mm | |
| November | 139.4 mm | |
| December | 130.8 mm |
Monthly Rainy Days (avg days with rain > 0.1mm)
| Month | Avg Rainy Days | Bar |
|---|---|---|
| January | 13.8 | |
| February | 8.6 | |
| March | 12.8 | |
| April | 13.6 | |
| May | 15.2 | |
| June | 9.2 | |
| July | 5.4 | |
| August | 11.4 | |
| September | 13.0 | |
| October | 14.0 | |
| November | 16.0 | |
| December | 14.6 |
Monthly Humidity (%)
| Month | Avg Humidity | Bar |
|---|---|---|
| January | 80.2% | |
| February | 76.9% | |
| March | 73.1% | |
| April | 70.3% | |
| May | 69.4% | |
| June | 64.0% | |
| July | 57.8% | |
| August | 61.8% | |
| September | 69.5% | |
| October | 78.1% | |
| November | 81.1% | |
| December | 82.8% |
Monthly Wind Speed (avg max km/h)
| Month | Avg Max Wind | Bar |
|---|---|---|
| January | 15.7 km/h | |
| February | 15.6 km/h | |
| March | 17.4 km/h | |
| April | 17.3 km/h | |
| May | 17.1 km/h | |
| June | 17.4 km/h | |
| July | 18.6 km/h | |
| August | 17.9 km/h | |
| September | 16.3 km/h | |
| October | 15.3 km/h | |
| November | 15.4 km/h | |
| December | 15.7 km/h |
Monthly UV Index (avg max)
| Month | UV Index | Risk Level | Bar |
|---|---|---|---|
| January | — | — | |
| February | — | — | |
| March | — | — | |
| April | — | — | |
| May | — | — | |
| June | — | — | |
| July | — | — | |
| August | — | — | |
| September | — | — | |
| October | — | — | |
| November | — | — | |
| December | — | — |
Monthly Snowfall (cm)
| Month | Avg Snowfall | Bar |
|---|---|---|
| January | 0.1 cm | |
| February | 0.0 cm | |
| March | 0.0 cm | |
| April | 0.2 cm | |
| May | 0.0 cm | |
| June | 0.0 cm | |
| July | 0.0 cm | |
| August | 0.0 cm | |
| September | 0.0 cm | |
| October | 0.0 cm | |
| November | 0.0 cm | |
| December | 0.0 cm |
Monthly Sunshine Hours (daily average)
| Month | Avg Daily Sunshine | Bar |
|---|---|---|
| January | 7.1 hrs | |
| February | 8.7 hrs | |
| March | 9.4 hrs | |
| April | 10.8 hrs | |
| May | 11.6 hrs | |
| June | 13.2 hrs | |
| July | 13.8 hrs | |
| August | 12.7 hrs | |
| September | 10.9 hrs | |
| October | 8.8 hrs | |
| November | 7.3 hrs | |
| December | 6.6 hrs |
Frequently Asked Questions
What is the hottest month in Rome?
July is the hottest month with an average temperature of 27.4°C (81.3°F).
What is the coldest month in Rome?
January is the coldest month with an average temperature of 7.8°C (46.0°F).
What is the rainiest month in Rome?
November is the wettest month with an average of 139.4mm of precipitation. The city experiences about 148.0 rainy days per year.
When is the best time to visit Rome?
The best time to visit Rome is during July, June, September, when temperatures are comfortable and rainfall is lower.
Cities with Similar Climate (Mediterranean)
Other Cities in Italy
Data Source: Open-Meteo historical archive (2020-01-01 to 2024-12-31). Daily measurements aggregated into monthly climate normals. Coordinates: 41.9°, 12.5°. Timezone: Europe/Rome. Last updated: 2026-07-30.