London Climate & Weather Averages
United Kingdom · Oceanic climate · Data averaged from 2020-01-01 to 2024-12-31 (5 years)
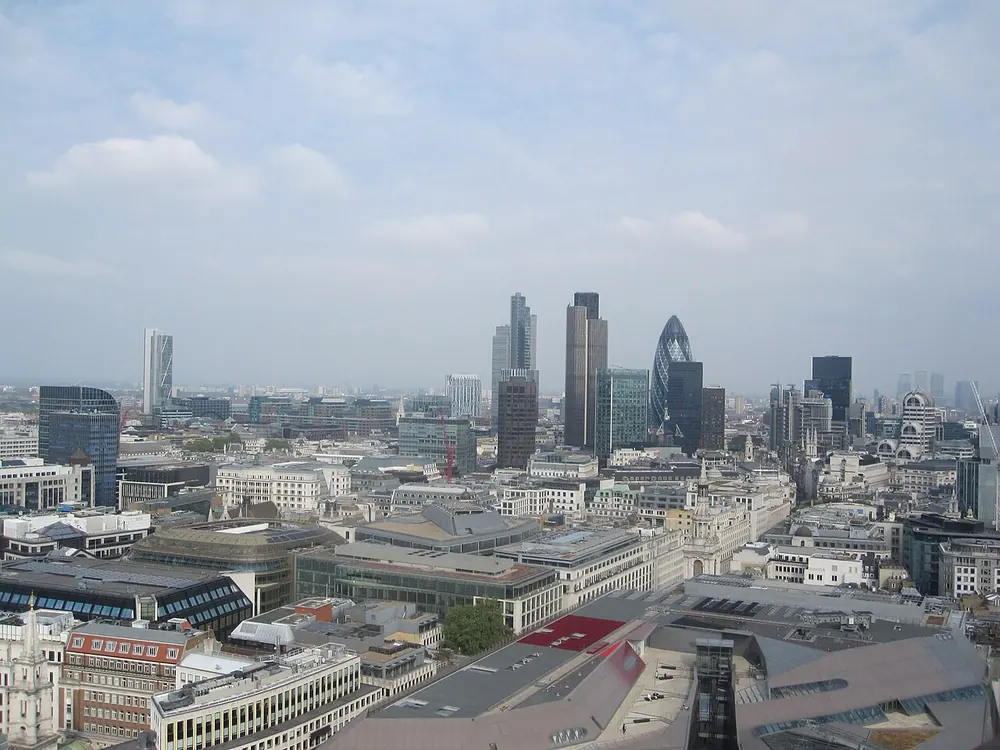
Best Time to Visit London
Based on temperature comfort, low rainfall, and sunshine hours, the best months to visit London are:
July, August, June
Scores based on ideal temperature (18-28°C), low precipitation, and high sunshine. July scores 54/100.
London has a Oceanic climate with mild summers and cold winters. The warmest month is August with an average temperature of 18.4°C (65.1°F), while January is the coldest at 4.9°C (40.8°F). Annual precipitation averages 777.0mm spread across approximately 203.0 rainy days per year, with October being the wettest month at 106.6mm and April the driest at 40.9mm. The city receives an average of 3.1-11.8 hours of sunshine per day, with the sunniest months being June and July. Humidity remains relatively consistent throughout the year, averaging around 78.7% annually, while average wind speeds reach 22.1 km/h. The overall annual mean temperature is 11.5°C (52.7°F), reflecting the oceanic conditions shaped by London's latitude (51.51°) and surrounding geography. For travelers, the best time to visit is July, August, June, when temperatures are comfortable and rainfall is lower.
Having spent three winters in London, I can tell you the drizzle never really stops — it just changes intensity. The data says October is wettest, but honestly, it's the persistence rather than volume that gets you. May is my favorite: parks burst into bloom and you'll catch surprising stretches of sunshine between showers. The numbers say June-August is 'best,' but pack a light jacket regardless.
Climate Insights from Our Writers
“What strikes me most about London's climate is how the drizzle becomes a character in the city's story. I've spent countless mornings walking along the Thames, feeling that persistent mist that seems to hang in the air for days on end. The data shows October as the wettest month, but honestly, it's the consistency rather than the volume that defines London's relationship with rain. I've noticed something fascinating about how Londoners respond to their weather — a brief appearance of sunshine in May transforms the entire city, with parks filling up as if by magic. The temperature rarely swings to extremes, hovering between 2°C in January and 23°C in July, which creates a remarkably stable environment for the city's famous gardens. What I find most intriguing is the microclimate effect within the city itself; central London can be several degrees warmer than the outskirts due to the urban heat island effect. The city's position in the southeast of England means it's actually one of the drier parts of the UK, though visitors would never guess that from the grey skies. The autumn months, particularly October, bring a golden quality to the light that photographers chase relentlessly. I've come to appreciate that London's weather isn't about perfection — it's about character. The way the city shrugs off another rainy day and continues its business is, in itself, a testament to the resilience that climate shapes in its inhabitants. For travelers, the secret is simple: embrace the layers, carry a compact umbrella, and understand that the weather is part of the London experience, not an obstacle to it.”
— Climate & Travel Writer
Seasonal Climate Overview
Spring (Mar-May)
Average temperature 9.9°C (49.8°F), rainfall 53.3mm, sunshine 9.0 hrs/day, humidity 74.8%. Mild transitional weather characterizes this period. Expect around 16.5 rainy days per month.
Summer (Jun-Aug)
Average temperature 17.7°C (63.9°F), rainfall 58.2mm, sunshine 11.1 hrs/day, humidity 71.6%. Mild transitional weather characterizes this period. Expect around 17.2 rainy days per month.
Autumn (Sep-Nov)
Average temperature 12.4°C (54.3°F), rainfall 82.4mm, sunshine 6.5 hrs/day, humidity 82.7%. Mild transitional weather characterizes this period. Expect around 17.5 rainy days per month.
Winter (Dec-Feb)
Average temperature 6.1°C (43.0°F), rainfall 65.2mm, sunshine 4.1 hrs/day, humidity 85.7%. Cold season conditions dominate. Expect around 16.5 rainy days per month.
Monthly Temperature Averages (°C / °F)
| Month | Avg High | Avg Low | Mean Temp |
|---|---|---|---|
| January | 7.9°C (46.2°F) | 2.0°C (35.6°F) | 4.9°C (40.8°F) |
| February | 10.1°C (50.2°F) | 3.6°C (38.5°F) | 6.9°C (44.4°F) |
| March | 11.4°C (52.5°F) | 4.0°C (39.2°F) | 7.6°C (45.7°F) |
| April | 13.9°C (57.0°F) | 4.8°C (40.6°F) | 9.2°C (48.6°F) |
| May | 17.6°C (63.7°F) | 8.4°C (47.1°F) | 13.0°C (55.4°F) |
| June | 21.2°C (70.2°F) | 11.6°C (52.9°F) | 16.6°C (61.9°F) |
| July | 22.5°C (72.5°F) | 13.7°C (56.7°F) | 18.1°C (64.6°F) |
| August | 22.8°C (73.0°F) | 14.1°C (57.4°F) | 18.4°C (65.1°F) |
| September | 20.5°C (68.9°F) | 12.1°C (53.8°F) | 16.1°C (61.0°F) |
| October | 16.0°C (60.8°F) | 9.2°C (48.6°F) | 12.6°C (54.7°F) |
| November | 11.4°C (52.5°F) | 5.6°C (42.1°F) | 8.5°C (47.3°F) |
| December | 8.8°C (47.8°F) | 4.1°C (39.4°F) | 6.5°C (43.7°F) |
Monthly Precipitation (mm)
| Month | Avg Rainfall | Bar |
|---|---|---|
| January | 64.2 mm | |
| February | 64.6 mm | |
| March | 60.9 mm | |
| April | 40.9 mm | |
| May | 58.1 mm | |
| June | 61.2 mm | |
| July | 64.6 mm | |
| August | 48.7 mm | |
| September | 70.0 mm | |
| October | 106.6 mm | |
| November | 70.5 mm | |
| December | 66.8 mm |
Monthly Rainy Days (avg days with rain > 0.1mm)
| Month | Avg Rainy Days | Bar |
|---|---|---|
| January | 14.8 | |
| February | 16.8 | |
| March | 19.0 | |
| April | 13.6 | |
| May | 17.0 | |
| June | 16.4 | |
| July | 18.2 | |
| August | 17.0 | |
| September | 16.0 | |
| October | 22.2 | |
| November | 14.4 | |
| December | 18.0 |
Monthly Humidity (%)
| Month | Avg Humidity | Bar |
|---|---|---|
| January | 86.9% | |
| February | 82.2% | |
| March | 79.1% | |
| April | 72.3% | |
| May | 73.1% | |
| June | 71.0% | |
| July | 70.9% | |
| August | 72.8% | |
| September | 77.8% | |
| October | 83.9% | |
| November | 86.4% | |
| December | 88.0% |
Monthly Wind Speed (avg max km/h)
| Month | Avg Max Wind | Bar |
|---|---|---|
| January | 23.0 km/h | |
| February | 27.3 km/h | |
| March | 24.1 km/h | |
| April | 21.7 km/h | |
| May | 21.0 km/h | |
| June | 20.0 km/h | |
| July | 21.0 km/h | |
| August | 20.8 km/h | |
| September | 20.0 km/h | |
| October | 22.8 km/h | |
| November | 21.2 km/h | |
| December | 22.2 km/h |
Monthly UV Index (avg max)
| Month | UV Index | Risk Level | Bar |
|---|---|---|---|
| January | — | — | |
| February | — | — | |
| March | — | — | |
| April | — | — | |
| May | — | — | |
| June | — | — | |
| July | — | — | |
| August | — | — | |
| September | — | — | |
| October | — | — | |
| November | — | — | |
| December | — | — |
Monthly Snowfall (cm)
| Month | Avg Snowfall | Bar |
|---|---|---|
| January | 1.1 cm | |
| February | 0.8 cm | |
| March | 1.4 cm | |
| April | 0.2 cm | |
| May | 0.0 cm | |
| June | 0.0 cm | |
| July | 0.0 cm | |
| August | 0.0 cm | |
| September | 0.0 cm | |
| October | 0.0 cm | |
| November | 0.6 cm | |
| December | 0.5 cm |
Monthly Sunshine Hours (daily average)
| Month | Avg Daily Sunshine | Bar |
|---|---|---|
| January | 4.3 hrs | |
| February | 4.8 hrs | |
| March | 6.5 hrs | |
| April | 9.7 hrs | |
| May | 10.8 hrs | |
| June | 11.8 hrs | |
| July | 11.3 hrs | |
| August | 10.1 hrs | |
| September | 8.6 hrs | |
| October | 6.4 hrs | |
| November | 4.6 hrs | |
| December | 3.1 hrs |
Frequently Asked Questions
What is the hottest month in London?
August is the hottest month with an average temperature of 18.4°C (65.1°F).
What is the coldest month in London?
January is the coldest month with an average temperature of 4.9°C (40.8°F).
What is the rainiest month in London?
October is the wettest month with an average of 106.6mm of precipitation. The city experiences about 203.0 rainy days per year.
When is the best time to visit London?
The best time to visit London is during July, August, June, when temperatures are comfortable and rainfall is lower.
Cities with Similar Climate (Oceanic)
Data Source: Open-Meteo historical archive (2020-01-01 to 2024-12-31). Daily measurements aggregated into monthly climate normals. Coordinates: 51.51°, -0.13°. Timezone: Europe/London. Last updated: 2026-07-30.