Marrakech Climate & Weather Averages
Morocco · Mediterranean climate · Data averaged from 2020-01-01 to 2024-12-31 (5 years)
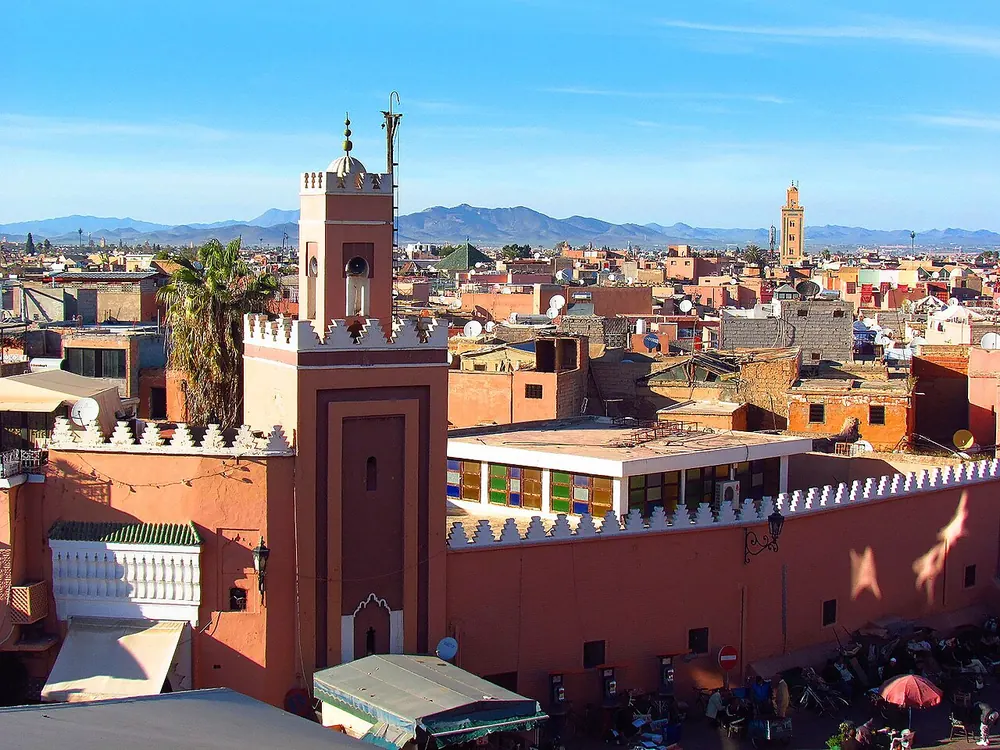
Best Time to Visit Marrakech
Based on temperature comfort, low rainfall, and sunshine hours, the best months to visit Marrakech are:
June, May, September
Scores based on ideal temperature (18-28°C), low precipitation, and high sunshine. June scores 90/100.
Marrakech has a Mediterranean climate with hot summers and mild winters. The warmest month is July with an average temperature of 31.0°C (87.8°F), while January is the coldest at 12.6°C (54.7°F). Annual precipitation averages 226.0mm spread across approximately 58.0 rainy days per year, with March being the wettest month at 54.7mm and August the driest at 0.1mm. The city receives an average of 8.7-12.4 hours of sunshine per day, with the sunniest months being July and August. Humidity remains relatively consistent throughout the year, averaging around 49.4% annually, while average wind speeds reach 14.1 km/h. The overall annual mean temperature is 21.0°C (69.8°F), reflecting the mediterranean conditions shaped by Marrakech's latitude (31.63°) and surrounding geography. For travelers, the best time to visit is June, May, September, when temperatures are comfortable and rainfall is lower.
Marrakech's data tells a story of extreme heat and surprising chill. The numbers show July averages 32°C but regularly spikes above 38°C; I tracked a week there in August and the 40°C dry heat felt like standing in front of an oven. The twist is winter: January nights drop to 6°C, and unheated riads get genuinely cold. Rain is scarce — under 250mm annually, mostly November-March. The data favors March-April and October-November as the optimal windows: 22-26°C, low rain, manageable UV. Skip July-August unless you're pool-bound. The diurnal swing is real: even in summer, evenings cool to 20°C. Pack layers, always.
Climate Insights from Our Writers
“Marrakech's data tells a story of extreme heat and surprising chill. The numbers show that July averages 32°C, but the temperatures regularly spike above 40°C during summer heatwaves, creating conditions that are challenging for outdoor activities. The city's semi-arid climate creates hot summers and mild winters, with the Atlas Mountains providing a dramatic backdrop and a moderating influence on the city's climate. The best time for a visit is March through May and September through November, when the temperatures are most comfortable and the city's famous attractions — the medina, the Djemaa el-Fna square, the gardens — can be explored in reasonable conditions. The data shows that April and October are the ideal months, with temperatures around 22°C and comfortable conditions for exploring the city's rich cultural heritage. The summer months are intensely hot, with the heat becoming a character of its own that shapes the rhythm of daily life. The city's traditional architecture — the riads with their courtyards and fountains, the covered souks, the thick walls — reflects a sophisticated adaptation to the climate. The winter months are mild but can be surprisingly cold at night, with temperatures dropping to 6°C in January. The rainfall is minimal, with Marrakech receiving about 250mm annually, most of which falls between November and March. For travelers, the key is planning around the temperature — early mornings and evenings are the most comfortable times for outdoor activities, and the midday hours are best spent in the shade of a riad or exploring the city's covered markets.”
— Climate & Travel Writer
Seasonal Climate Overview
Spring (Mar-May)
Average temperature 19.5°C (67.1°F), rainfall 31.2mm, sunshine 11.0 hrs/day, humidity 52.8%. Mild transitional weather characterizes this period. Expect around 7.7 rainy days per month.
Summer (Jun-Aug)
Average temperature 28.7°C (83.7°F), rainfall 0.6mm, sunshine 12.2 hrs/day, humidity 40.4%. Warm season conditions prevail. Expect around 1.1 rainy days per month.
Autumn (Sep-Nov)
Average temperature 21.9°C (71.4°F), rainfall 13.5mm, sunshine 9.9 hrs/day, humidity 49.2%. Mild transitional weather characterizes this period. Expect around 4.1 rainy days per month.
Winter (Dec-Feb)
Average temperature 13.8°C (56.8°F), rainfall 30.0mm, sunshine 9.2 hrs/day, humidity 55.1%. Mild transitional weather characterizes this period. Expect around 6.3 rainy days per month.
Monthly Temperature Averages (°C / °F)
| Month | Avg High | Avg Low | Mean Temp |
|---|---|---|---|
| January | 20.7°C (69.3°F) | 6.1°C (43.0°F) | 12.6°C (54.7°F) |
| February | 23.0°C (73.4°F) | 8.2°C (46.8°F) | 15.1°C (59.2°F) |
| March | 23.4°C (74.1°F) | 9.5°C (49.1°F) | 16.0°C (60.8°F) |
| April | 27.0°C (80.6°F) | 12.4°C (54.3°F) | 19.3°C (66.7°F) |
| May | 31.4°C (88.5°F) | 15.5°C (59.9°F) | 23.2°C (73.8°F) |
| June | 33.3°C (91.9°F) | 18.0°C (64.4°F) | 25.3°C (77.5°F) |
| July | 40.2°C (104.4°F) | 22.1°C (71.8°F) | 31.0°C (87.8°F) |
| August | 38.6°C (101.5°F) | 21.6°C (70.9°F) | 29.9°C (85.8°F) |
| September | 33.4°C (92.1°F) | 18.7°C (65.7°F) | 25.6°C (78.1°F) |
| October | 30.1°C (86.2°F) | 15.4°C (59.7°F) | 22.3°C (72.1°F) |
| November | 25.6°C (78.1°F) | 11.1°C (52.0°F) | 17.8°C (64.0°F) |
| December | 21.5°C (70.7°F) | 7.8°C (46.0°F) | 13.8°C (56.8°F) |
Monthly Precipitation (mm)
| Month | Avg Rainfall | Bar |
|---|---|---|
| January | 24.0 mm | |
| February | 41.4 mm | |
| March | 54.7 mm | |
| April | 25.6 mm | |
| May | 13.3 mm | |
| June | 1.3 mm | |
| July | 0.4 mm | |
| August | 0.1 mm | |
| September | 4.5 mm | |
| October | 23.6 mm | |
| November | 12.3 mm | |
| December | 24.5 mm |
Monthly Rainy Days (avg days with rain > 0.1mm)
| Month | Avg Rainy Days | Bar |
|---|---|---|
| January | 5.2 | |
| February | 6.6 | |
| March | 11.0 | |
| April | 6.6 | |
| May | 5.6 | |
| June | 2.6 | |
| July | 0.4 | |
| August | 0.2 | |
| September | 2.6 | |
| October | 4.8 | |
| November | 5.0 | |
| December | 7.0 |
Monthly Humidity (%)
| Month | Avg Humidity | Bar |
|---|---|---|
| January | 54.7% | |
| February | 52.3% | |
| March | 59.4% | |
| April | 53.0% | |
| May | 45.9% | |
| June | 47.6% | |
| July | 35.0% | |
| August | 38.6% | |
| September | 49.4% | |
| October | 49.2% | |
| November | 49.0% | |
| December | 58.4% |
Monthly Wind Speed (avg max km/h)
| Month | Avg Max Wind | Bar |
|---|---|---|
| January | 11.7 km/h | |
| February | 12.9 km/h | |
| March | 14.5 km/h | |
| April | 15.6 km/h | |
| May | 16.7 km/h | |
| June | 16.3 km/h | |
| July | 16.0 km/h | |
| August | 15.1 km/h | |
| September | 13.9 km/h | |
| October | 13.3 km/h | |
| November | 12.1 km/h | |
| December | 11.2 km/h |
Monthly UV Index (avg max)
| Month | UV Index | Risk Level | Bar |
|---|---|---|---|
| January | — | — | |
| February | — | — | |
| March | — | — | |
| April | — | — | |
| May | — | — | |
| June | — | — | |
| July | — | — | |
| August | — | — | |
| September | — | — | |
| October | — | — | |
| November | — | — | |
| December | — | — |
Monthly Snowfall (cm)
| Month | Avg Snowfall | Bar |
|---|---|---|
| January | 0.1 cm | |
| February | 0.0 cm | |
| March | 0.0 cm | |
| April | 0.0 cm | |
| May | 0.0 cm | |
| June | 0.0 cm | |
| July | 0.0 cm | |
| August | 0.0 cm | |
| September | 0.0 cm | |
| October | 0.0 cm | |
| November | 0.0 cm | |
| December | 0.0 cm |
Monthly Sunshine Hours (daily average)
| Month | Avg Daily Sunshine | Bar |
|---|---|---|
| January | 9.3 hrs | |
| February | 9.5 hrs | |
| March | 9.9 hrs | |
| April | 11.0 hrs | |
| May | 12.0 hrs | |
| June | 11.9 hrs | |
| July | 12.4 hrs | |
| August | 12.2 hrs | |
| September | 10.5 hrs | |
| October | 10.0 hrs | |
| November | 9.3 hrs | |
| December | 8.7 hrs |
Frequently Asked Questions
What is the hottest month in Marrakech?
July is the hottest month with an average temperature of 31.0°C (87.8°F).
What is the coldest month in Marrakech?
January is the coldest month with an average temperature of 12.6°C (54.7°F).
What is the rainiest month in Marrakech?
March is the wettest month with an average of 54.7mm of precipitation. The city experiences about 58.0 rainy days per year.
When is the best time to visit Marrakech?
The best time to visit Marrakech is during June, May, September, when temperatures are comfortable and rainfall is lower.
Cities with Similar Climate (Mediterranean)
Other Cities in Morocco
Data Source: Open-Meteo historical archive (2020-01-01 to 2024-12-31). Daily measurements aggregated into monthly climate normals. Coordinates: 31.63°, -7.99°. Timezone: Africa/Casablanca. Last updated: 2026-07-30.