Buenos Aires Climate & Weather Averages
Argentina · Humid Subtropical climate · Data averaged from 2020-01-01 to 2024-12-31 (5 years)
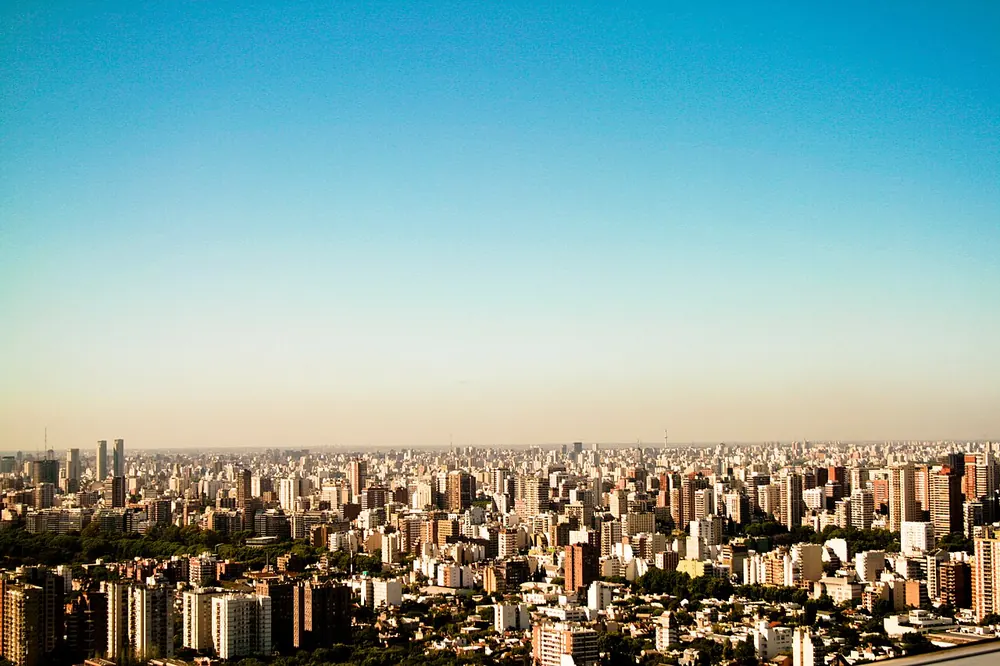
Best Time to Visit Buenos Aires
Based on temperature comfort, low rainfall, and sunshine hours, the best months to visit Buenos Aires are:
December, February, January
Scores based on ideal temperature (18-28°C), low precipitation, and high sunshine. December scores 67/100.
Buenos Aires has a Humid Subtropical climate with warm summers and mild winters. The warmest month is January with an average temperature of 24.7°C (76.5°F), while July is the coldest at 10.4°C (50.7°F). Annual precipitation averages 894.0mm spread across approximately 125.0 rainy days per year, with March being the wettest month at 166.9mm and June the driest at 35.7mm. The city receives an average of 7.5-12.6 hours of sunshine per day, with the sunniest months being December and January. Humidity remains relatively consistent throughout the year, averaging around 72.6% annually, while average wind speeds reach 23.4 km/h. The overall annual mean temperature is 17.6°C (63.7°F), reflecting the humid subtropical conditions shaped by Buenos Aires's latitude (-34.61°) and surrounding geography. For travelers, the best time to visit is December, February, January, when temperatures are comfortable and rainfall is lower.
If you're planning outdoor activities in Buenos Aires, the seasons are flipped but mild. I ran the Costanera Sur in January (summer): 30°C with 70% humidity, draining but the river breeze helped. March-April is the outdoor sweet spot: 22°C, manageable UV, empty paths. October-November is similarly ideal — jacarandas blooming, 20°C, perfect cycling weather. July (winter) brings 12°C and dampness; running is fine but mornings feel raw. UV peaks dangerously in January (11+); sun protection is mandatory between 10am-4pm. The wind off the Río de la Plata is constant and can be bracing in winter.
Climate Insights from Our Writers
“Buenos Aires offers a climate that's the mirror image of the Northern Hemisphere, and I've found the seasonal reversal fascinating to study. The city's humid subtropical climate creates warm summers (December to February) and mild winters (June to August), with an annual average temperature of 17°C. The data shows that January is the warmest month at 25°C, while July is the coolest at 11°C. The city's position on the Rio de la Plata creates a moderating influence, with the river acting as a thermal reservoir that keeps temperatures stable. The wind is a defining factor — the constant breeze off the river provides natural air conditioning in summer but can make winter days feel colder than the temperature suggests. The best time for a visit is March through May and September through November, when temperatures are most comfortable and the city's outdoor attractions — the parks, the waterfront, the neighborhoods — are at their most accessible. The data shows that April is the ideal month, with temperatures around 18°C, low humidity, and clear skies. The summer months can be hot and humid, with temperatures reaching 30°C and afternoon thunderstorms common. The winter months are mild but damp, with frequent rain and overcast skies. The rainfall is distributed fairly evenly throughout the year, with about 1,200mm annually. For travelers, Buenos Aires offers a climate that rewards those who plan around the shoulder seasons, when the weather is most accommodating and the city's famous outdoor lifestyle — the cafés, the parks, the street art — can be enjoyed in comfort.”
— Climate & Travel Writer
Seasonal Climate Overview
Spring (Mar-May)
Average temperature 17.9°C (64.2°F), rainfall 104.5mm, sunshine 9.0 hrs/day, humidity 76.2%. Mild transitional weather characterizes this period. Expect around 10.1 rainy days per month.
Summer (Jun-Aug)
Average temperature 11.3°C (52.3°F), rainfall 46.0mm, sunshine 7.9 hrs/day, humidity 78.0%. Mild transitional weather characterizes this period. Expect around 9.5 rainy days per month.
Autumn (Sep-Nov)
Average temperature 17.5°C (63.5°F), rainfall 73.8mm, sunshine 10.4 hrs/day, humidity 70.0%. Mild transitional weather characterizes this period. Expect around 10.8 rainy days per month.
Winter (Dec-Feb)
Average temperature 23.7°C (74.7°F), rainfall 73.8mm, sunshine 12.1 hrs/day, humidity 66.1%. Warm season conditions prevail. Expect around 11.2 rainy days per month.
Monthly Temperature Averages (°C / °F)
| Month | Avg High | Avg Low | Mean Temp |
|---|---|---|---|
| January | 28.6°C (83.5°F) | 21.0°C (69.8°F) | 24.7°C (76.5°F) |
| February | 27.5°C (81.5°F) | 19.7°C (67.5°F) | 23.5°C (74.3°F) |
| March | 25.6°C (78.1°F) | 19.2°C (66.6°F) | 22.2°C (72.0°F) |
| April | 21.2°C (70.2°F) | 14.8°C (58.6°F) | 18.0°C (64.4°F) |
| May | 17.0°C (62.6°F) | 10.1°C (50.2°F) | 13.4°C (56.1°F) |
| June | 14.8°C (58.6°F) | 8.4°C (47.1°F) | 11.5°C (52.7°F) |
| July | 14.0°C (57.2°F) | 7.1°C (44.8°F) | 10.4°C (50.7°F) |
| August | 15.8°C (60.4°F) | 8.5°C (47.3°F) | 12.0°C (53.6°F) |
| September | 18.1°C (64.6°F) | 10.8°C (51.4°F) | 14.4°C (57.9°F) |
| October | 21.5°C (70.7°F) | 13.3°C (55.9°F) | 17.3°C (63.1°F) |
| November | 25.0°C (77.0°F) | 17.0°C (62.6°F) | 20.9°C (69.6°F) |
| December | 26.8°C (80.2°F) | 18.9°C (66.0°F) | 22.8°C (73.0°F) |
Monthly Precipitation (mm)
| Month | Avg Rainfall | Bar |
|---|---|---|
| January | 75.1 mm | |
| February | 79.2 mm | |
| March | 166.9 mm | |
| April | 98.9 mm | |
| May | 47.6 mm | |
| June | 35.7 mm | |
| July | 43.2 mm | |
| August | 59.0 mm | |
| September | 63.5 mm | |
| October | 66.2 mm | |
| November | 91.6 mm | |
| December | 67.1 mm |
Monthly Rainy Days (avg days with rain > 0.1mm)
| Month | Avg Rainy Days | Bar |
|---|---|---|
| January | 11.2 | |
| February | 11.0 | |
| March | 13.2 | |
| April | 10.8 | |
| May | 6.4 | |
| June | 10.8 | |
| July | 8.6 | |
| August | 9.2 | |
| September | 9.6 | |
| October | 11.8 | |
| November | 11.0 | |
| December | 11.4 |
Monthly Humidity (%)
| Month | Avg Humidity | Bar |
|---|---|---|
| January | 65.6% | |
| February | 68.6% | |
| March | 74.2% | |
| April | 76.9% | |
| May | 77.4% | |
| June | 80.0% | |
| July | 78.8% | |
| August | 75.3% | |
| September | 74.4% | |
| October | 69.1% | |
| November | 66.5% | |
| December | 64.0% |
Monthly Wind Speed (avg max km/h)
| Month | Avg Max Wind | Bar |
|---|---|---|
| January | 25.9 km/h | |
| February | 23.8 km/h | |
| March | 23.4 km/h | |
| April | 22.4 km/h | |
| May | 21.5 km/h | |
| June | 20.7 km/h | |
| July | 21.8 km/h | |
| August | 22.8 km/h | |
| September | 24.3 km/h | |
| October | 25.0 km/h | |
| November | 25.3 km/h | |
| December | 24.0 km/h |
Monthly UV Index (avg max)
| Month | UV Index | Risk Level | Bar |
|---|---|---|---|
| January | — | — | |
| February | — | — | |
| March | — | — | |
| April | — | — | |
| May | — | — | |
| June | — | — | |
| July | — | — | |
| August | — | — | |
| September | — | — | |
| October | — | — | |
| November | — | — | |
| December | — | — |
Monthly Sunshine Hours (daily average)
| Month | Avg Daily Sunshine | Bar |
|---|---|---|
| January | 12.1 hrs | |
| February | 11.5 hrs | |
| March | 10.1 hrs | |
| April | 8.8 hrs | |
| May | 8.1 hrs | |
| June | 7.5 hrs | |
| July | 7.9 hrs | |
| August | 8.3 hrs | |
| September | 9.0 hrs | |
| October | 10.6 hrs | |
| November | 11.5 hrs | |
| December | 12.6 hrs |
Frequently Asked Questions
What is the hottest month in Buenos Aires?
January is the hottest month with an average temperature of 24.7°C (76.5°F).
What is the coldest month in Buenos Aires?
July is the coldest month with an average temperature of 10.4°C (50.7°F).
What is the rainiest month in Buenos Aires?
March is the wettest month with an average of 166.9mm of precipitation. The city experiences about 125.0 rainy days per year.
When is the best time to visit Buenos Aires?
The best time to visit Buenos Aires is during December, February, January, when temperatures are comfortable and rainfall is lower.
Cities with Similar Climate (Humid Subtropical)
Data Source: Open-Meteo historical archive (2020-01-01 to 2024-12-31). Daily measurements aggregated into monthly climate normals. Coordinates: -34.61°, -58.38°. Timezone: America/Argentina/Buenos_Aires. Last updated: 2026-07-30.