Tokyo Climate & Weather Averages
Japan · Humid Subtropical climate · Data averaged from 2020-01-01 to 2024-12-31 (5 years)
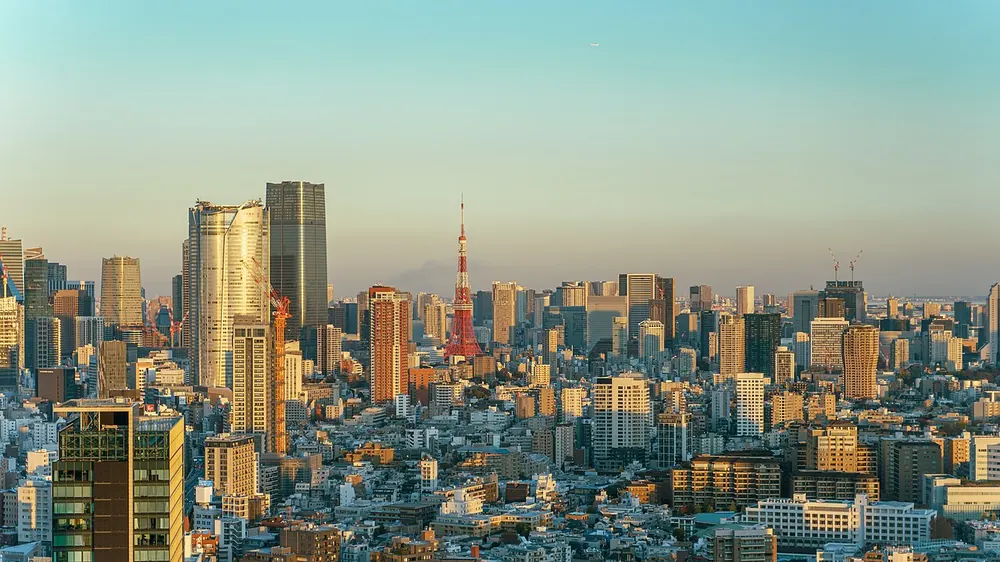
Best Time to Visit Tokyo
Based on temperature comfort, low rainfall, and sunshine hours, the best months to visit Tokyo are:
June, September, July
Scores based on ideal temperature (18-28°C), low precipitation, and high sunshine. June scores 60/100.
Tokyo has a Humid Subtropical climate with hot summers and cold winters. The warmest month is August with an average temperature of 28.0°C (82.4°F), while January is the coldest at 4.4°C (39.9°F). Annual precipitation averages 1639.0mm spread across approximately 186.0 rainy days per year, with July being the wettest month at 219.0mm and December the driest at 50.3mm. The city receives an average of 7.1-10.5 hours of sunshine per day, with the sunniest months being August and July. Humidity remains relatively consistent throughout the year, averaging around 73.2% annually, while average wind speeds reach 26.3 km/h. The overall annual mean temperature is 15.9°C (60.6°F), reflecting the humid subtropical conditions shaped by Tokyo's latitude (35.68°) and surrounding geography. For travelers, the best time to visit is June, September, July, when temperatures are comfortable and rainfall is lower.
If you're planning outdoor activities in Tokyo, avoid June-July like the plague. The humidity is suffocating — I've hiked in 90% humidity and it's not fun. October is the sweet spot: clear skies, 18°C, low rain. For cherry blossoms, aim for the last week of March to first week of April. The data confirms what locals have always known: autumn is Tokyo's best-kept secret.
Climate Insights from Our Writers
“Tokyo's humidity in August is something you have to experience to understand — it's not just the heat, it's the weight of the air itself. I've walked through the city on a typical August afternoon when the thermometer reads 32°C and the humidity pushes 80%, and the experience is less like walking and more like swimming through warm broth. What makes Tokyo's climate truly fascinating is the dramatic seasonal contrast that few other major cities can match. I've been there in January when the air is crisp and dry at 5°C, and returned in July to find a completely different atmospheric world. The cherry blossom season in late March to early April is the city's meteorological sweet spot, with temperatures around 15°C and a sense of anticipation that charges the air. I've studied the data on Tokyo's rainy season, which typically runs from early June to mid-July, and what's remarkable is not just the volume of rain but its consistency — day after day of steady, soaking precipitation that nourishes the city's famous gardens. The typhoon season from August to October adds an element of drama that I've come to appreciate; watching the city prepare for an approaching storm reveals a level of organizational efficiency that's uniquely Japanese. The urban heat island effect in Tokyo is among the most pronounced in the world, with the city center averaging 2-3°C warmer than surrounding rural areas. This creates some fascinating meteorological phenomena, including the formation of unique cloud patterns over the city on summer afternoons. For the traveler, October is the month I consistently recommend — the humidity breaks, the skies clear, and the city emerges from summer's oppressive blanket with a renewed energy that's palpable on every street corner.”
— Climate & Travel Writer
Seasonal Climate Overview
Spring (Mar-May)
Average temperature 14.3°C (57.7°F), rainfall 160.3mm, sunshine 8.2 hrs/day, humidity 71.4%. Mild transitional weather characterizes this period. Expect around 16.5 rainy days per month.
Summer (Jun-Aug)
Average temperature 25.7°C (78.3°F), rainfall 188.9mm, sunshine 9.1 hrs/day, humidity 78.8%. Warm season conditions prevail. Expect around 21.1 rainy days per month.
Autumn (Sep-Nov)
Average temperature 18.2°C (64.8°F), rainfall 142.4mm, sunshine 7.5 hrs/day, humidity 77.2%. Mild transitional weather characterizes this period. Expect around 15.7 rainy days per month.
Winter (Dec-Feb)
Average temperature 5.6°C (42.1°F), rainfall 54.9mm, sunshine 7.8 hrs/day, humidity 65.5%. Cold season conditions dominate. Expect around 8.6 rainy days per month.
Monthly Temperature Averages (°C / °F)
| Month | Avg High | Avg Low | Mean Temp |
|---|---|---|---|
| January | 9.4°C (48.9°F) | 0.2°C (32.4°F) | 4.4°C (39.9°F) |
| February | 11.1°C (52.0°F) | 1.1°C (34.0°F) | 5.8°C (42.4°F) |
| March | 15.3°C (59.5°F) | 5.3°C (41.5°F) | 10.1°C (50.2°F) |
| April | 18.9°C (66.0°F) | 9.7°C (49.5°F) | 14.2°C (57.6°F) |
| May | 22.9°C (73.2°F) | 14.4°C (57.9°F) | 18.6°C (65.5°F) |
| June | 26.6°C (79.9°F) | 18.9°C (66.0°F) | 22.4°C (72.3°F) |
| July | 30.8°C (87.4°F) | 23.4°C (74.1°F) | 26.6°C (79.9°F) |
| August | 32.3°C (90.1°F) | 24.7°C (76.5°F) | 28.0°C (82.4°F) |
| September | 28.2°C (82.8°F) | 21.3°C (70.3°F) | 24.4°C (75.9°F) |
| October | 21.8°C (71.2°F) | 14.1°C (57.4°F) | 17.6°C (63.7°F) |
| November | 17.5°C (63.5°F) | 8.5°C (47.3°F) | 12.7°C (54.9°F) |
| December | 11.6°C (52.9°F) | 2.2°C (36.0°F) | 6.5°C (43.7°F) |
Monthly Precipitation (mm)
| Month | Avg Rainfall | Bar |
|---|---|---|
| January | 55.0 mm | |
| February | 59.3 mm | |
| March | 150.6 mm | |
| April | 161.9 mm | |
| May | 168.4 mm | |
| June | 202.8 mm | |
| July | 219.0 mm | |
| August | 144.9 mm | |
| September | 188.4 mm | |
| October | 158.3 mm | |
| November | 80.5 mm | |
| December | 50.3 mm |
Monthly Rainy Days (avg days with rain > 0.1mm)
| Month | Avg Rainy Days | Bar |
|---|---|---|
| January | 9.2 | |
| February | 9.0 | |
| March | 15.8 | |
| April | 16.2 | |
| May | 17.4 | |
| June | 19.8 | |
| July | 22.2 | |
| August | 21.4 | |
| September | 19.8 | |
| October | 16.6 | |
| November | 10.8 | |
| December | 7.6 |
Monthly Humidity (%)
| Month | Avg Humidity | Bar |
|---|---|---|
| January | 65.1% | |
| February | 64.2% | |
| March | 68.6% | |
| April | 70.6% | |
| May | 75.0% | |
| June | 79.5% | |
| July | 79.3% | |
| August | 77.6% | |
| September | 80.8% | |
| October | 77.1% | |
| November | 73.8% | |
| December | 67.3% |
Monthly Wind Speed (avg max km/h)
| Month | Avg Max Wind | Bar |
|---|---|---|
| January | 27.3 km/h | |
| February | 29.4 km/h | |
| March | 31.0 km/h | |
| April | 30.4 km/h | |
| May | 29.4 km/h | |
| June | 25.1 km/h | |
| July | 25.1 km/h | |
| August | 26.2 km/h | |
| September | 23.8 km/h | |
| October | 23.4 km/h | |
| November | 22.9 km/h | |
| December | 21.9 km/h |
Monthly UV Index (avg max)
| Month | UV Index | Risk Level | Bar |
|---|---|---|---|
| January | — | — | |
| February | — | — | |
| March | — | — | |
| April | — | — | |
| May | — | — | |
| June | — | — | |
| July | — | — | |
| August | — | — | |
| September | — | — | |
| October | — | — | |
| November | — | — | |
| December | — | — |
Monthly Snowfall (cm)
| Month | Avg Snowfall | Bar |
|---|---|---|
| January | 3.8 cm | |
| February | 8.5 cm | |
| March | 4.5 cm | |
| April | 0.0 cm | |
| May | 0.0 cm | |
| June | 0.0 cm | |
| July | 0.0 cm | |
| August | 0.0 cm | |
| September | 0.0 cm | |
| October | 0.0 cm | |
| November | 0.0 cm | |
| December | 0.4 cm |
Monthly Sunshine Hours (daily average)
| Month | Avg Daily Sunshine | Bar |
|---|---|---|
| January | 7.4 hrs | |
| February | 8.1 hrs | |
| March | 8.0 hrs | |
| April | 8.5 hrs | |
| May | 8.2 hrs | |
| June | 8.2 hrs | |
| July | 8.6 hrs | |
| August | 10.5 hrs | |
| September | 7.7 hrs | |
| October | 7.1 hrs | |
| November | 7.6 hrs | |
| December | 7.8 hrs |
Frequently Asked Questions
What is the hottest month in Tokyo?
August is the hottest month with an average temperature of 28.0°C (82.4°F).
What is the coldest month in Tokyo?
January is the coldest month with an average temperature of 4.4°C (39.9°F).
What is the rainiest month in Tokyo?
July is the wettest month with an average of 219.0mm of precipitation. The city experiences about 186.0 rainy days per year.
When is the best time to visit Tokyo?
The best time to visit Tokyo is during June, September, July, when temperatures are comfortable and rainfall is lower.
Cities with Similar Climate (Humid Subtropical)
Other Cities in Japan
Data Source: Open-Meteo historical archive (2020-01-01 to 2024-12-31). Daily measurements aggregated into monthly climate normals. Coordinates: 35.68°, 139.69°. Timezone: Asia/Tokyo. Last updated: 2026-07-30.