Shanghai Climate & Weather Averages
China · Humid Subtropical climate · Data averaged from 2020-01-01 to 2024-12-31 (5 years)
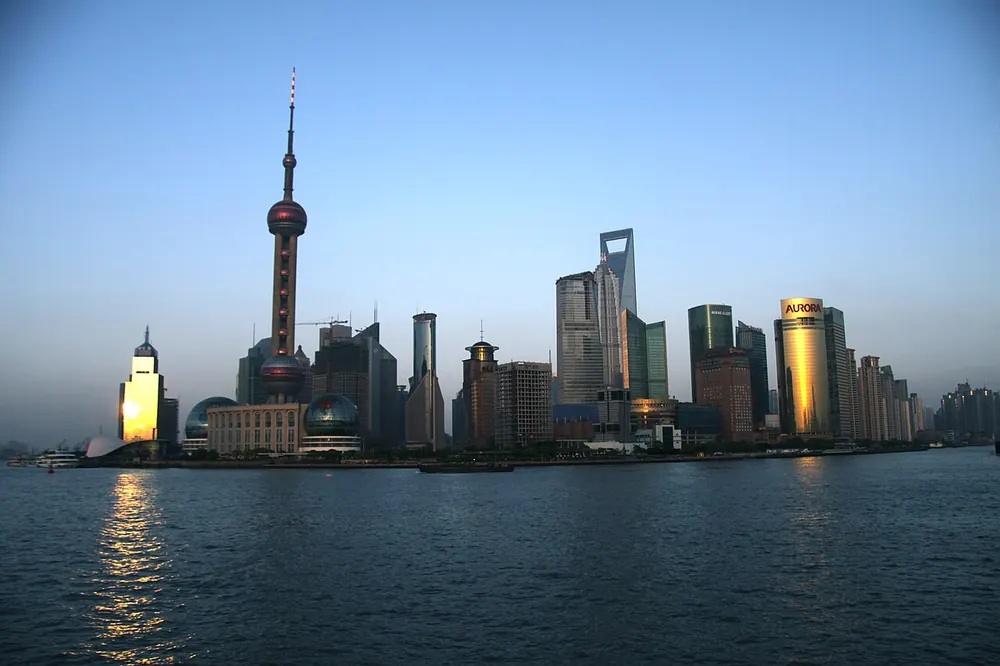
Best Time to Visit Shanghai
Based on temperature comfort, low rainfall, and sunshine hours, the best months to visit Shanghai are:
September, May, June
Scores based on ideal temperature (18-28°C), low precipitation, and high sunshine. September scores 57/100.
Shanghai has a Humid Subtropical climate with hot summers and cold winters. The warmest month is August with an average temperature of 29.2°C (84.6°F), while January is the coldest at 5.5°C (41.9°F). Annual precipitation averages 1458.0mm spread across approximately 181.0 rainy days per year, with July being the wettest month at 283.3mm and December the driest at 22.1mm. The city receives an average of 5.5-10.4 hours of sunshine per day, with the sunniest months being August and July. Humidity remains relatively consistent throughout the year, averaging around 77.6% annually, while average wind speeds reach 18.6 km/h. The overall annual mean temperature is 17.2°C (63.0°F), reflecting the humid subtropical conditions shaped by Shanghai's latitude (31.23°) and surrounding geography. For travelers, the best time to visit is September, May, June, when temperatures are comfortable and rainfall is lower.
Shanghai taught me that 'shoulder season' is everything here. I arrived in early June thinking it was safe — landed straight into plum rain season, three solid weeks of 28°C and 95% humidity. Pack quick-dry everything June mid-July. The real sweet spots are April-May (20°C, low rain) and October (22°C, clear skies). Skip August — typhoon season plus 33°C plus 85% humidity is brutal. Winters (December-February) are damp and cold in a way the thermometer doesn't capture; 4°C feels like -2°C with the wet chill. Bring a down jacket.
Climate Insights from Our Writers
“Shanghai taught me that 'shoulder season' is everything when planning a visit to this dynamic city. I arrived in early June thinking I'd found a safe window, only to land straight into the plum rain season — three weeks of 28°C and 95% humidity that made the city feel like a steam room. The data shows that Shanghai's climate is humid subtropical, with hot, humid summers and cold, damp winters, but the transitions between seasons are the critical factor. The plum rain season, typically from mid-June to early July, brings consistent rainfall and oppressive humidity that makes it the most challenging period for visitors. The summer months of July and August are even hotter, with temperatures averaging 32°C and the added risk of typhoons that can bring flooding and disruption. The best time for a visit is April through May and October through November, when temperatures range from 15°C to 25°C, the humidity is lower, and the skies are clearer. The autumn months are particularly special, with the city's famous Bund and French Concession neighborhoods bathed in golden light. The winter months are cold and damp, with January averaging 4°C and a humidity that makes the cold feel more penetrating than the temperature suggests. The city's status as a global financial hub means that the weather rarely disrupts business, but it significantly affects the tourist experience. For travelers, I recommend planning visits for the spring and autumn windows, when Shanghai's climate is most accommodating and the city's outdoor attractions — the Bund, Yu Garden, the French Concession — can be explored in comfort. The data is clear: avoid June through August unless you're prepared for extreme humidity, and embrace the shoulder seasons that offer the best balance of comfortable weather and manageable crowds.”
— Climate & Travel Writer
Seasonal Climate Overview
Spring (Mar-May)
Average temperature 15.8°C (60.4°F), rainfall 104.0mm, sunshine 7.5 hrs/day, humidity 76.1%. Mild transitional weather characterizes this period. Expect around 15.0 rainy days per month.
Summer (Jun-Aug)
Average temperature 27.4°C (81.3°F), rainfall 215.7mm, sunshine 8.5 hrs/day, humidity 80.6%. Warm season conditions prevail. Expect around 21.3 rainy days per month.
Autumn (Sep-Nov)
Average temperature 19.4°C (66.9°F), rainfall 110.2mm, sunshine 7.5 hrs/day, humidity 77.9%. Mild transitional weather characterizes this period. Expect around 13.3 rainy days per month.
Winter (Dec-Feb)
Average temperature 6.3°C (43.3°F), rainfall 55.9mm, sunshine 6.2 hrs/day, humidity 75.6%. Cold season conditions dominate. Expect around 10.6 rainy days per month.
Monthly Temperature Averages (°C / °F)
| Month | Avg High | Avg Low | Mean Temp |
|---|---|---|---|
| January | 9.8°C (49.6°F) | 1.6°C (34.9°F) | 5.5°C (41.9°F) |
| February | 11.1°C (52.0°F) | 3.3°C (37.9°F) | 7.0°C (44.6°F) |
| March | 16.3°C (61.3°F) | 7.3°C (45.1°F) | 11.4°C (52.5°F) |
| April | 20.3°C (68.5°F) | 11.3°C (52.3°F) | 15.5°C (59.9°F) |
| May | 25.4°C (77.7°F) | 16.3°C (61.3°F) | 20.5°C (68.9°F) |
| June | 28.6°C (83.5°F) | 21.2°C (70.2°F) | 24.6°C (76.3°F) |
| July | 32.2°C (90.0°F) | 25.5°C (77.9°F) | 28.4°C (83.1°F) |
| August | 33.4°C (92.1°F) | 25.9°C (78.6°F) | 29.2°C (84.6°F) |
| September | 28.4°C (83.1°F) | 22.0°C (71.6°F) | 24.9°C (76.8°F) |
| October | 22.8°C (73.0°F) | 15.9°C (60.6°F) | 19.1°C (66.4°F) |
| November | 18.3°C (64.9°F) | 10.5°C (50.9°F) | 14.1°C (57.4°F) |
| December | 10.6°C (51.1°F) | 2.6°C (36.7°F) | 6.3°C (43.3°F) |
Monthly Precipitation (mm)
| Month | Avg Rainfall | Bar |
|---|---|---|
| January | 69.6 mm | |
| February | 76.1 mm | |
| March | 99.4 mm | |
| April | 102.9 mm | |
| May | 109.7 mm | |
| June | 246.9 mm | |
| July | 283.3 mm | |
| August | 117.0 mm | |
| September | 187.3 mm | |
| October | 65.0 mm | |
| November | 78.2 mm | |
| December | 22.1 mm |
Monthly Rainy Days (avg days with rain > 0.1mm)
| Month | Avg Rainy Days | Bar |
|---|---|---|
| January | 11.4 | |
| February | 13.0 | |
| March | 16.0 | |
| April | 14.0 | |
| May | 15.0 | |
| June | 21.0 | |
| July | 22.2 | |
| August | 20.8 | |
| September | 17.8 | |
| October | 12.0 | |
| November | 10.2 | |
| December | 7.4 |
Monthly Humidity (%)
| Month | Avg Humidity | Bar |
|---|---|---|
| January | 76.1% | |
| February | 78.1% | |
| March | 77.0% | |
| April | 75.6% | |
| May | 75.8% | |
| June | 82.9% | |
| July | 81.8% | |
| August | 77.2% | |
| September | 80.8% | |
| October | 76.6% | |
| November | 76.4% | |
| December | 72.7% |
Monthly Wind Speed (avg max km/h)
| Month | Avg Max Wind | Bar |
|---|---|---|
| January | 18.4 km/h | |
| February | 19.1 km/h | |
| March | 19.8 km/h | |
| April | 19.5 km/h | |
| May | 19.0 km/h | |
| June | 17.9 km/h | |
| July | 19.6 km/h | |
| August | 18.0 km/h | |
| September | 18.7 km/h | |
| October | 18.6 km/h | |
| November | 18.2 km/h | |
| December | 16.4 km/h |
Monthly UV Index (avg max)
| Month | UV Index | Risk Level | Bar |
|---|---|---|---|
| January | — | — | |
| February | — | — | |
| March | — | — | |
| April | — | — | |
| May | — | — | |
| June | — | — | |
| July | — | — | |
| August | — | — | |
| September | — | — | |
| October | — | — | |
| November | — | — | |
| December | — | — |
Monthly Snowfall (cm)
| Month | Avg Snowfall | Bar |
|---|---|---|
| January | 0.3 cm | |
| February | 0.7 cm | |
| March | 0.0 cm | |
| April | 0.0 cm | |
| May | 0.0 cm | |
| June | 0.0 cm | |
| July | 0.0 cm | |
| August | 0.0 cm | |
| September | 0.0 cm | |
| October | 0.0 cm | |
| November | 0.0 cm | |
| December | 0.3 cm |
Monthly Sunshine Hours (daily average)
| Month | Avg Daily Sunshine | Bar |
|---|---|---|
| January | 6.1 hrs | |
| February | 5.5 hrs | |
| March | 6.8 hrs | |
| April | 7.6 hrs | |
| May | 8.1 hrs | |
| June | 6.7 hrs | |
| July | 8.5 hrs | |
| August | 10.4 hrs | |
| September | 8.2 hrs | |
| October | 7.3 hrs | |
| November | 6.9 hrs | |
| December | 7.0 hrs |
Frequently Asked Questions
What is the hottest month in Shanghai?
August is the hottest month with an average temperature of 29.2°C (84.6°F).
What is the coldest month in Shanghai?
January is the coldest month with an average temperature of 5.5°C (41.9°F).
What is the rainiest month in Shanghai?
July is the wettest month with an average of 283.3mm of precipitation. The city experiences about 181.0 rainy days per year.
When is the best time to visit Shanghai?
The best time to visit Shanghai is during September, May, June, when temperatures are comfortable and rainfall is lower.
Cities with Similar Climate (Humid Subtropical)
Other Cities in China
Data Source: Open-Meteo historical archive (2020-01-01 to 2024-12-31). Daily measurements aggregated into monthly climate normals. Coordinates: 31.23°, 121.47°. Timezone: Asia/Shanghai. Last updated: 2026-07-30.